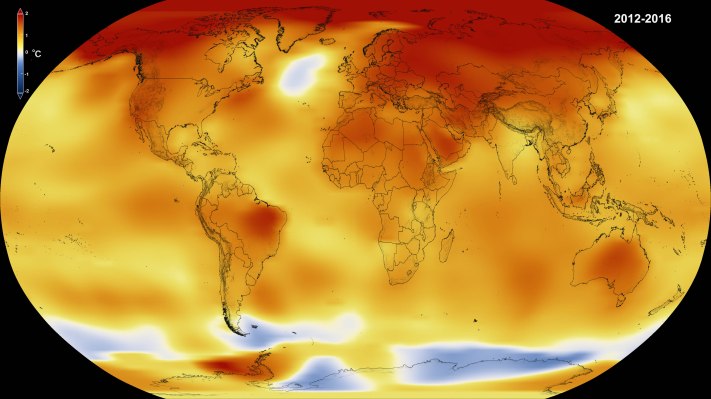
NASA announced on Wednesday that in 2016, Earth experienced the hottest surface temperatures in modern history. Separate, independent analysis at NOAA provided the same conclusion. This makes the third year in a row that Earth experienced record high temperatures.
These record years are part of a concerning long-term trend of increasing global temperatures. In fact, 16 of the 17 warmest years on record have occurred since 2001.
“2016 is remarkably the third record year in a row in this series. We don’t expect record years every year, but the ongoing long-term warming trend is clear.” Gavin Schmidt, Goddard Institute for Space Studies Director
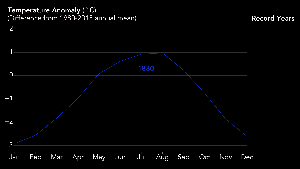
Monthly global temperature averages from 1880 to present day / Courtesy of NASA/Joshua Stevens, Earth Observatory
So how does NASA take the Earth’s temperature?
Well, for starters, NASA’s Global Temperature video below (which you’ve probably seen shared with any article on climate change) is based on a network of over 6,000 sensors set up on land, sea, and in Antarctica.
The animation above shows higher than average temperatures in red and lower than average temperatures in blue. The map does not show temperatures itself. This is why the poles are much redder than, say, the equator. Multiple research studies have shown that the poles are warming twice as fast as other parts of the planet due to a number of factors including the amplified effect that melting ice caps have on the ability to reflect (rather than absorb) sunlight.
Dr. Gavin Schmidt, the Director of the NASA Goddard Institute for Space Studies elaborates on this topic telling TechCrunch that, in addition to their vast sensor network, NASA leverages a system of Earth-Observing satellites to get a full picture of the climate.
“We need many additional sources of information to be able to put these changes in context. We use GRACE satellites to track the mass loss from the ice sheets, JASON2/3 to track the sea level rise, CloudSat and Calypso to track shifts in the clouds, TRMM and GPM for the shifts in rainfall, SSMI for sea ice extent etc.” Gavin Schmidt, Goddard Institute for Space Studies Director
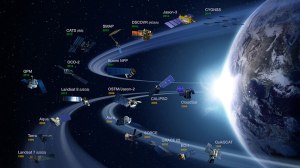
NASA’s network of Earth Observing Satellites / Image courtesy of NASA
It’s also important to note that temperatures in the record-setting years of 2015 and 2016 were intensified by a weather pattern known as El Niño. An El Niño is one of the most well-known climate patterns and occurs every three to seven years. During an El Niño year, a number of things happen. For example, some parts of the world will experience higher than average rainfall while other areas will experience more extreme droughts.
An El Niño also causes temperatures in the Pacific Ocean to rise as high as three to five degrees above average. Because of this, some (including the U.S. House Committee on Science, Space, and Technology) have inaccurately reported that without the El Niño, there would be no cause for concern.
Instead, researchers estimate that the El Niño only increased the annual global temperature in 2016 by 0.2 degrees Fahrenheit. To put that in perspective:
- 2014 was initially the hottest year on record with average global surface temperatures 1.4 degrees Fahrenheit higher than the late 19th century average
- 2015 replace 2014 as the new hottest year on record with average global surface temperatures 1.8 degrees Fahrenheit higher than the late 19th century average
- 2016 is now the hottest year on record with average global surface temperatures 2 degrees Fahrenheit higher than the late 19th century average
So, even without the 0.2 degree Fahrenheit contribution from El Niño, 2016 would still be among the top three hottest years in recorded history.
“Phenomena such as El Niño or La Niña, which warm or cool the upper tropical Pacific Ocean and cause corresponding variations in global wind and weather patterns, contribute to short-term variations in global average temperature.” NASA Press Office
This news comes just days before the new President takes office – an administration with a reputation for downplaying the effects of climate change (or ignoring its existence entirely).
In an Op-Ed for Space News, Donald Trump’s senior advisers Bob Walker and Peter Navarro wrote that “NASA should be focused primarily on deep space activities rather than Earth-centric work.” Their belief is that climate science should be handled by other agencies.
In a separate interview for The Guardian, Mr. Walker explained that President-Elect Trump is set to eliminate all climate change research conducted by NASA in an effort to crack down on “politicized science.”
As the Earth continues to warm and a new administration takes office, many will be watching out for policy changes that could affect our ability to monitor the planet’s climate altogether.