Amazon today is rolling out a tool to help developers dive deep into their existing applications to diagnose each element of the application’s processes in order to get a full snapshot of how an application is performing.
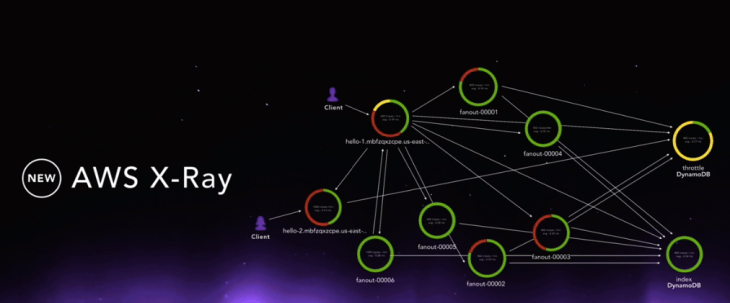
Called X-Ray, developers can use the tool to dive into individual processes in order to identify bottlenecks or see individual performance of functions within an app. With it, developers can see what areas might be able to improve or better configure in order to get an application to run more smoothly. The application spreads out into a wide graph of all of the application’s operations, and users can dive into each of those nodes.
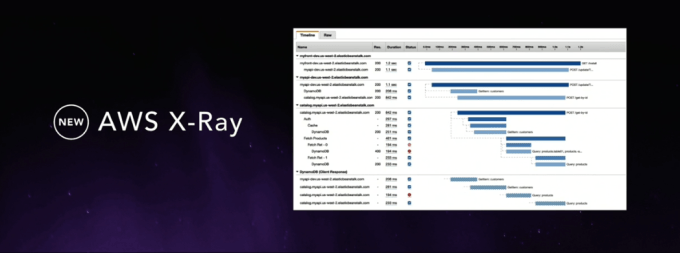
Amazon captures this trace data from code running on EC2 instances, AWS Elastic Beanstalk, Amazon API Gateway and more. Developers can also dig into specific time frames where they want to see the performance of those individual operations.
“With metrics you can only look at the outside,” Amazon.com CTO Werner Vogels said. “For that you need x-ray vision to dive into the application to see inside the application.”
The tool is designed to debug across hundreds of distributed micro services that can run in containers or the more traditional Amazon Machine Images. X-Ray provides a visual way to view and debug and trace issues. It allows you to analyze logs and find race conditions that may leave your applications unstable.
For developers, this may be a boon for all this to be integrated directly into AWS. If there are any parts that are causing an app to slow down or crash, it could lead to an overall drop in engagement. And that, in the end, can end up having a real financial cost to those developers. And larger companies that may be deploying on AWS need these kinds of tools. That’ll help Amazon keep ahead of the competition, but will also take away an opportunity for other companies to build these kinds of tools.