
Within the past few months, NetSuite, Marketo, LinkedIn, Fleetmatics and LogMeIn have each been acquired or merged for a combined value of more than $50 billion. At this rate, public SaaS companies may become an endangered species. Clearly, PE investors and larger technology companies sense opportunity and value.
What separates the chosen companies from the rest?
The Rule of 40 is a common VC and management trick to distinguish the best-run SaaS companies at scale from the rest of the pack. The Rule of 40 is incredibly simple to calculate — just add a company’s current growth rate and its profitability. This simple calculation lets you compare a company growing at 100 percent with -60 percent profit margins to a company growing at 40 percent at break-even or a company growing 10 percent but with 30 percent profits.
We’re often asked by our portfolio companies and prospective investments how to balance growth and profitability. Naturally, companies are focused on growth, but growth does come at a cost. Therefore, we’ve taken a new approach to the long-standing Rule of 40 to optimize for “efficient growth.”
Enter the Bessemer “Efficiency Score,” which measures a company’s efficiency by taking the sum total of a company’s percent growth + percent free cash flow (FCF) margin. This simple calculation quantifies the growth efficiency of a given cloud business. At different stages of a company’s life cycle, their Efficiency Score changes. But for the average public company a few years after IPO, an Efficiency Score above 40 is considered great.
For example: Public SaaS companies’ 2016 projections average 28 percent annual growth with 3 percent FCF margins, for an Efficiency Score of 31 percent. Slightly fewer than half of the current public SaaS companies have a combined growth and FCF margin above 40 percent.
But does the Efficiency Score actually mean anything, or is it just an easy discussion point at board meetings?
In reality, we found that a company’s Efficiency Score has a greater than 70 percent correlation to a public SaaS company’s revenue multiple, which is a company’s valuation divided by their revenue, and a standard metric for how investors price stocks. The top quartile of public SaaS companies by revenue multiple have an average Efficiency Score of 44 percent; the bottom quartile have a score of just 9 percent.
Public investors agonize over where to put their money, but with just two numbers and 15 seconds you can have a good sense of how a company will be valued.
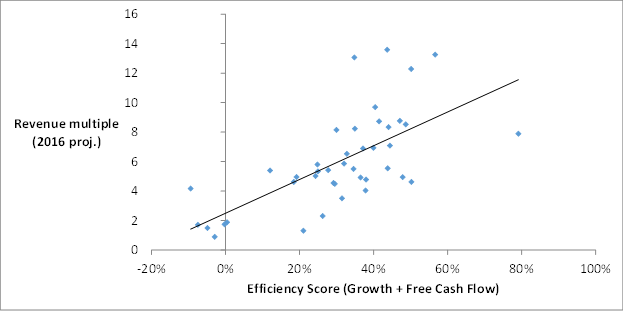
Chart 1: There is a strong correlation between revenue multiple and a company’s Efficiency Score (Source: CapIQ and BVP)
Are companies getting better?
Over the past four years, SaaS companies have been surprisingly consistent in their average Efficiency Score — from 28 percent to 31 percent. However, the composition of the score has changed a lot as public SaaS companies have matured. Whereas in 2012 the average public SaaS company was growing at 55 percent a year and losing -28 percent in FCF, by 2016 growth was down to 28 percent and with average profitability at 3 percent. This shift is fairly predictable — as companies like Salesforce and Workday have gotten bigger their growth has declined and profitability has improved.
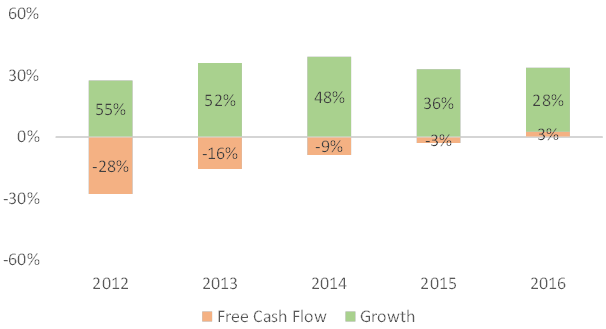
Chart 2: Average growth and FCF margin of public SaaS companies 2012-2016 (Source: CapIQ and BVP)
In fact, SaaS companies usually have the best Efficiency Score in the years preceding their IPO. Current cloud companies had an average Efficiency Score of 73 percent three years before their IPO, versus a mid-30s level post-IPO. The best cloud companies (those that go public) are incredibly efficient when they’re young and growing fast. As they mature, FCF grows as growth falls, but companies tend to become less efficient overall as increases in profitability rarely make up for stratospheric growth.
Efficiency Score of public SaaS companies @ IPO
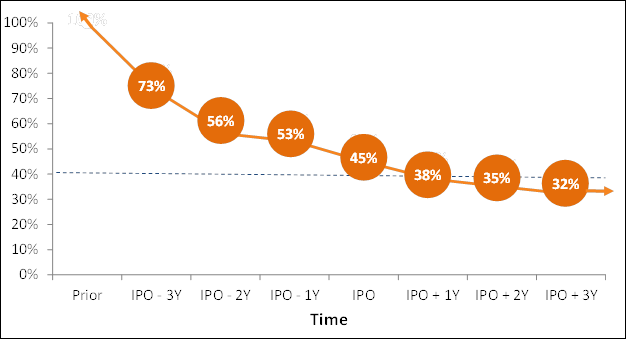
Chart 3: Efficiency Score of Public SaaS Companies at IPO (Source: CapIQ and BVP)
So what?
It’s not just public investors who are paying attention to the Efficiency Score. The following chart is a list of public SaaS companies, ranked by their 2016 Efficiency Score score. Four of these companies, Fleetmatics, LinkedIn, LogMeIn and Marketo, have been acquired (or, in the case of LogMeIn, merged). Three out of the four were in the top 11 companies ranked by their Efficiency Score when they were acquired. These companies were in entirely different industries — fleet management, social networking and remote connectivity, respectively — but their growth and relatively profitability made them top performers.
What’s more: All of these companies were trading relatively cheaply compared to their Efficiency Score. The top 10 Efficiency Score companies trade on a median of 8x, but Fleetmatics was trading at 4.8x, LinkedIn at 6.9x and LogMeIn at 6.9x. No wonder strategic acquirers saw a bargain!
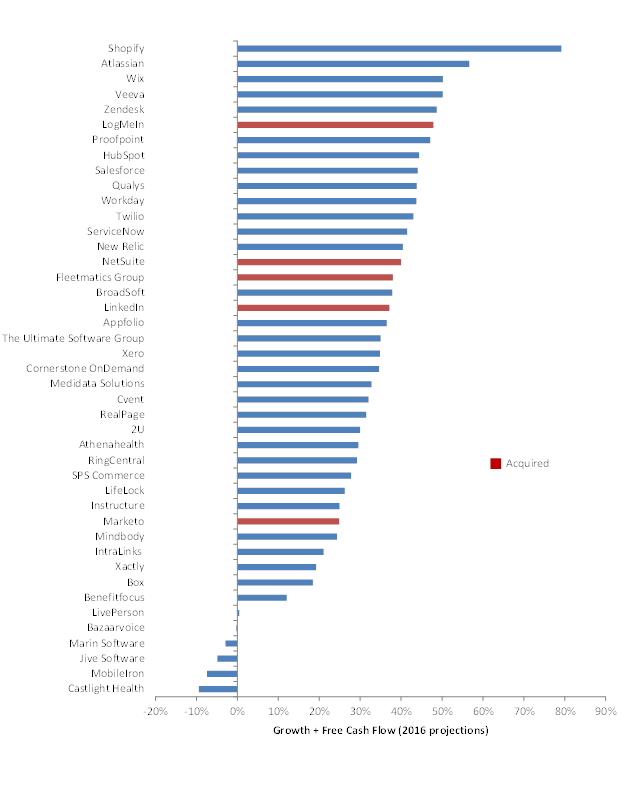
Chart 4: Public SaaS companies ranked by Efficiency Score (Source: CapIQ and BVP)
So, which public SaaS company could be next?
Our pick would be Qualys, a network security company. Qualys is in the top 10 Efficiency Score companies with 23 percent FCF margins and 21 percent growth, but trading at just 5.5x revenues, a steep discount to where similar companies are trading.