CartoDB, an online map maker and business intelligence startup, wants to make it easy for anyone to communicate information with a map. Today the startup is unleashing a new feature, One-Click Mapping, that will analyze any data you upload and automatically create maps showing the relevant information.
Originally, CartoDB provided software for map makers and data scientists, which required a basic understanding of statistics and geospatial data. Users had to distinguish which information was worth mapping and establish the parameters to visualize their data.
Now, anyone can plug in their data, choose from a list of suggested maps, and visualize what’s important in a single click.
The company was launched in 2011 by two Spanish biodiversity and conservation scientists who wanted a better tool to communicate their results. CartoDB has since been used by over 120,000 users to make 400,000 maps, visualizing everything from the worldwide, real-time reaction to Beyonce’s latest album release to the aftermath of the Nepal earthquake.
“A lot of times people miss how valuable location can be to communicate things,” says CartoDB Chief Science Officer Andrew Hill. “If you can connect information to geospatial data, people can understand how its affecting their daily life and really interact with the data.”
After users upload their data, CartoDB pulls apart the file and immediately detects any geospatial data. It then analyzes the other types of information in the file and suggests a handful of default map formats that users pick from and alter, if necessary.
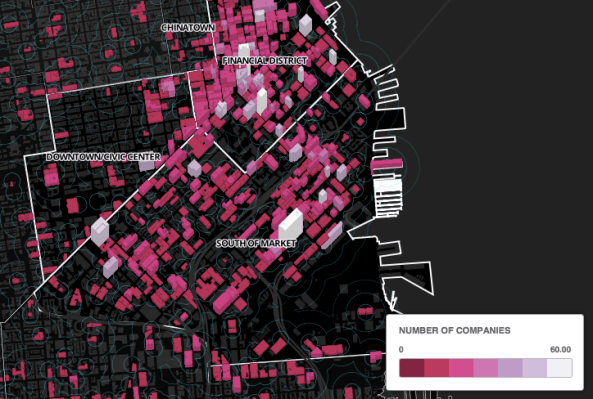
This can be incredibly useful for businesses to make sense of the vast amounts of data they’re collecting. Many big banks, for instance, are using CartoDB to analyze and visualize millions of credit card transactions to understand consumption patterns across different areas of a given city — like the map that BBVA made to demonstrate the economic impact of this year’s Mobile World Congress in Barcelona.
After Michael Brown was shot last year in Ferguson, Missouri, the Twitter data team used CartoDB to demonstrate how the news spread across the U.S. and then the world.
As more business users dump their data into CartoDB’s automatic mapping platform, the algorithm that decides which data to map (and which data to ignore) will get increasingly smarter.
“What our tool did from day one was solve the problem of making maps, but now we’re taking that extra step to show people that there’s a lot more in their data that they can map,” says Hill. “Now businesses can input the data that they have no time to dig into, and this allows the reporting to happen in a more timeless way.”
CartoDB raised an $8 million Series A round in September of last year led by Berlin-based firm Earlybird Venture Capital. The company is profitable and reports a 300 percent growth in both users and revenue over the last 12 months.