Smartsheet, the spreadsheet-based project and work management platform, is now making it easier for companies to understand how their employees actually work (and who they mostly work with). Companies mostly use the service to manage their projects and help employees collaborate. Because of this, the service knows quite a bit about who does what in a given business and now it allows businesses who opt in to this (and pay for it) to access this information through its highly visual Account Map tool.
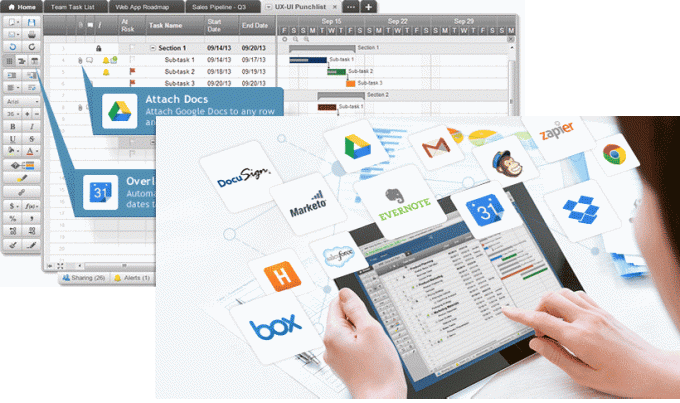
As Smartsheet chairman Brent Frei told me earlier this month, the team decided to go with spreadsheets because they are “conceptually free, easy to share and people immediately know what to do.” He believes that this is one of the main reasons the company is doing so well. The Smartsheet team tells me that the company now has over 50,000 companies with paid accounts on its network. It has also attracted a good $70 million in venture capital so far and grown to over 150 employees now.
The idea for the Account Maps came from the company’s larger customers, Frei told me. Those businesses wanted to get better visibility into what’s happening in their companies. So the Smartsheet team looked into what it could do with the data it was already collecting. Ideally, that means tracking all the different projects and people involved in them in a company. With this, you can see who runs most of the projects in a group, for example (which is great for when you ask for a raise) or who doesn’t (which isn’t so great when it’s time for your annual report). But you can also see the connections between different groups.
By default, Smartsheet makes a basic map available to all users. That’s not the interactive version, though. Smartsheet will happily create an interactive version for businesses that are willing to pay for it, though, and with that, users will be able to dig a bit deeper, down to the level of the individual employee.