Amazon Web Services users today got a new reporting tool for the EC2 cloud computing platform. This will make it quite a bit easier to track how they are using their regular and reserved instances and what it costs them.
Amazon used to do very little to hide the power of its cloud computing platform behind pretty, New Relic-like graphs and usage reports. Lately, however, it seems the company has been listening to its users. Earlier this month, the company launched a new Billing Console that gives users a dashboard with colorful, very un-AWS-like graphs to keep track of their cloud computing cost across Amazon’s services.
Today’s update is squarely focused on EC2. As Amazon notes, the new usage reports are meant to give you “insights into your instance usage and your usage patterns, and will provide you with information that you need to optimize your EC2 usage.”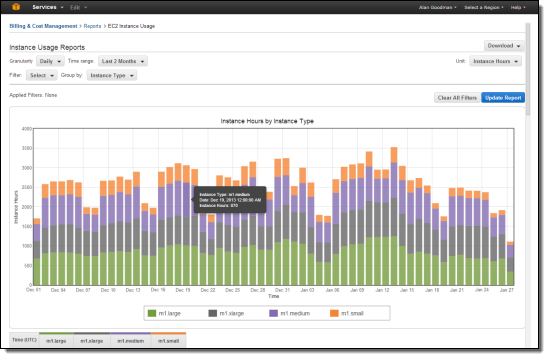
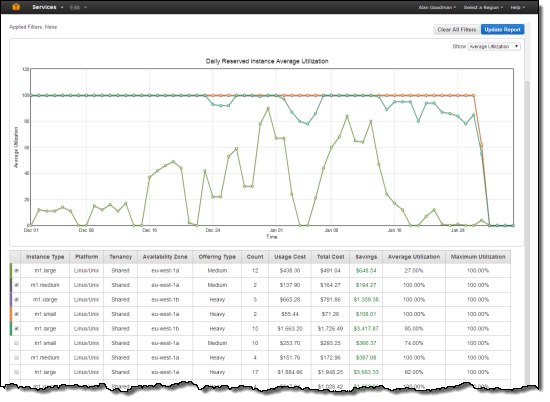
AWS users can use these new reports to track both their regular EC2 instances and reserved instances. The EC2 instance reports can be filtered by timeframe, availability zone, instance type, purchase option, tags and platform. For reserved instances, the report will display a utilization report and total cost, as well as a comparison of total cost savings compared to using on-demand instances.
With all of these recent updates, Amazon is slowly encroaching on the territory of Cloudability, RightScale’s Cloud Analytics and similar companies that grew out of the need for more transparent cost and utilization reports. It’s still a far way from offering a replacement for these tools (which also tend to focus on more cloud services than just Amazon’s). It is clear, however, that AWS is starting to listen to its users by making these reports available.