
Editor’s note: Jules Maltz is a General Partner and Parsa Saljoughian is an Associate at Institutional Venture Partners, a late-stage venture capital firm based in Menlo Park.
Paul Graham wrote a great post in which he defines a startup as a “company designed to grow fast” and encouraged founders to constantly measure their growth rates. For Y Combinator companies, he notes that a good growth rate is 5 to 7 percent per week, while an exceptional growth rate is 10 percent per week.
But 10 percent growth can’t last forever. If it did, the results would be astonishing. A company making $100 each week growing 10 percent weekly would generate $15 billion in annual revenue after just three years. Even Google and Facebook didn’t do that. The law of large numbers catches up to everyone.
So if the success of your startup is measured by your growth rate, how do you know if you’re growing fast enough?
At IVP, we researched this very question. We pulled data on Internet and software IPOs since 2010 and tracked the historical growth rates for each company for the four years before they went public and the year of the IPO. Some of the 70 companies on the list (like Groupon) grew incredibly quickly at first, but, as they scaled, they slowed down like a rocket ship getting pulled back down to Earth. Other companies (like HomeAway*) initially grew at a more measured pace but maintained this growth rate through their IPOs and beyond.
While every company and market is different, we aggregated the data to arrive at median growth rates at different revenue ranges (as shown in the graph below):
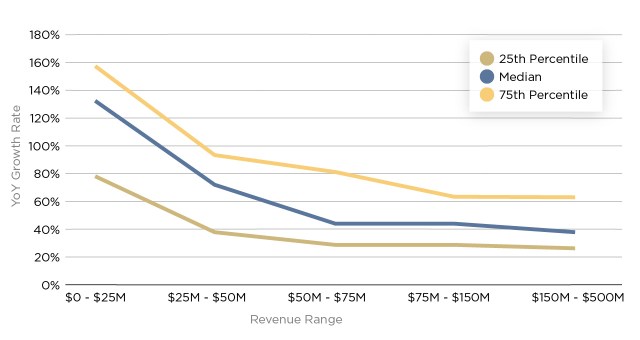 As the chart above shows, if you’re hoping to be a public company, you should be growing significantly faster (by percentage) the smaller you are. The median company with revenues between $0 and $25 million grew at a whopping 133 percent. As these companies scaled to the $150 million to $500 million revenue range, they grew at a more modest rate of 38 percent per year.
Additionally, the companies with the most successful IPOs (Tableau, Workday, Splunk, ServiceNow, Marketo*, LinkedIn, etc.) achieved growth rates at or above the median benchmarks in each of the years we examined before the IPO. As expected, the median revenue multiple at IPO for these companies was significantly higher at 7.3x. Conversely, the median revenue multiple for companies with growth rates below the median benchmarks in each of the years was only 3.8x.
We also learned a few other lessons:
Stay above 20 percent growth. Companies are only able to go public if they are growing quickly. Out of the 70 IPOs that we tracked in our analysis, 69 of them were growing faster than 20 percent in the year of their IPO, and 54 of them were growing faster than 30 percent.
All revenue is not created equal. The quality of the revenue matters just as much as the quantity and growth rate. The companies in our dataset that were valued most favorably at IPO have predictable revenue streams, high-gross margins and low customer churn. These companies generally avoid services and other one-time revenue.
Growth matters post-IPO, too. While we focused exclusively on pre-IPO data, these benchmarks hold true for public companies, as well. At the time of its IPO in May 2011, LinkedIn was valued at $4 billion. Since then, it has grown revenues above $1 billion at an 86 percent annual CAGR, which greatly exceeds our benchmarks. As a result, the company is valued at over $26 billion today.
* IVP is an investor in HomeAway and Marketo.
The complete dataset can be downloaded here.
[Image via Shutterstock]