Analytics company KISSmetrics has launched a new feature that should make it easier for customers to answer complicated questions that usually require lots of database queries and technical implementation.
Large companies usually have huge stores of customer data, but in order to create comprehensible reports from that data, KISSMetrics says enterprises hire a team of technical consultants or devote lots of their technical team’s time to “enormous SQL queries and manual data pulls.” The Power Report, on the other hand, requires zero setup and presents a non-technical interface for identifying the data that you need.
As one example, KISSmetrics said a SaaS company launching new marketing channels could create a Power Report analyzing the new users and providing information like monthly customer signups, what channel they used to sign up, the amount each customer paid per month, and more. Or a media company that A/B tests multiple landing pages over the course of a year could create a report showing their entire history of tests, along with relevant data for each page like number of comments, number of visitors, engagement, and revenue.
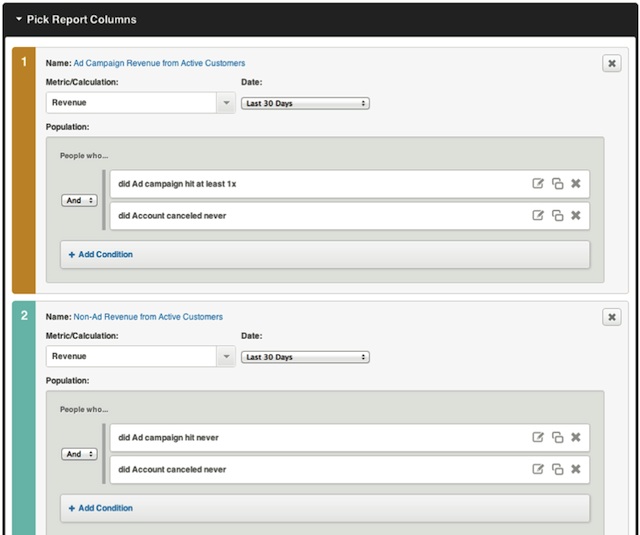
And as you can see in the screenshot above, the reports can be highly customizable without requiring any complicated database queries. Companies use drop-down menus to identify which metrics they’re interested in and which visitor groups they want to compare.
Although the company is officially launching the feature now, it has already been quietly offering Power Reports as part of its enterprise pricing plans. Co-founder Hiten Shah said the feature has attracted a positive response from both larger companies and small startups that are glad they don’t have to “spend energy and time and waste our engineers’ time” creating these reports on their own.
You can read more about the new Power Reports in this PDF.

