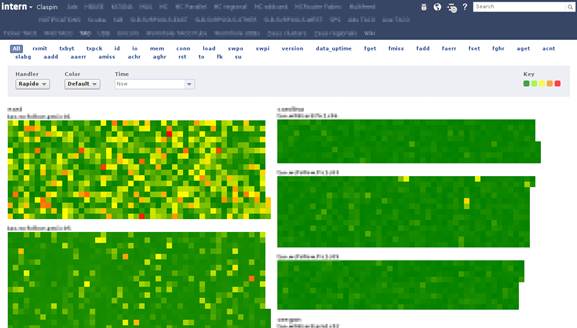
Facebook engineer Sean Lynch has built a mind-blowing, custom server-monitoring tool for the company that uses heat mapping to keep tabs on a huge number of servers at a glance.
Lynch is part of the cache performance team at Facebook. When things go wrong he needs to know quickly whether problems are being caused by caching or something else. Off the shelf monitoring tools just weren’t good enough.
So he built Claspin, a server-monitoring system named after a protein that monitors cells for DNA damage. And today he’s giving curious readers a tour of the system in a post on the Facebook Engineering Blog.

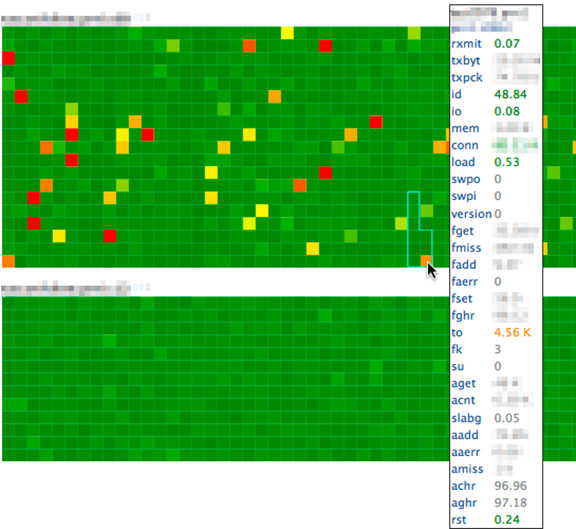
Claspin displays grid-like maps representing servers grouped by rack. Each cell of the grid represents one server, and its color depends on the health of that particular server. Green for good, red for bad, yellow for in-between and black if it’s missing a stat (which means it’s probably down). This visualization approach enables Facebook engineers to check the status of a huge number of servers at once.
“On a 30″ screen we could easily fit 10,000 hosts at the same time, with 30 or more stats contributing to their color, updated in real time — usually in a matter of seconds or minutes,” Lynch writes.
“When I first deployed Claspin, the view above had a lot more red in it,” he writes. “By making it easier for more people to spot server issues quickly, Claspin has allowed us to catch more ‘yellows’ and prevent more ‘reds.'”
As to how Claspin determines the health of a system, Lynch writes: “I settled on coloring a host by its ‘hottest’ statistic, with hotness computed from predefined thresholds. It’s dirt simple, but it gives us a way to encode tribal knowledge about what values are ‘bad’ into the view.”

Claspin provides a tabbed interface so that Lynch can toggle between different views. He can also change which stats affect the color of the cells. “Mousing over a host draws an outline around its rack and pops up a tooltip with the hostname, rack number, and all the stats Claspin is looking at for that host, with the values colored based on Claspin’s thresholds for that stat,” he writes.
The interface is entirely browser-based. Coloring is done with JavaScript and the heatmaps are drawn with SVG. You can find out more and see a couple more screenshots on Lynch’s blog post.
Facebook engineers have talked about Claspin before in interviews, but I think this is the first time we’ve gotten a peek behind the curtain.
It doesn’t look like the company is open sourcing this project quite yet. “We always try to open source tools like this, so it’s something we’ll consider with Claspin,” a Facebook spokesperson told me. “But it’s possible that it’s so tightly integrated with our infrastructure that it wouldn’t be broadly useful.”
Facebook has open sourced a lot of its custom-built development and operations software, including the NoSQL database Apache Cassandra and its PHP to C++ transformer HipHop. It’s even gone so far as to open source its data center infrastructure plans. So don’t be surprised to see this hit GitHub in the future.
In the meantime, who’s going to be the first to clone it?
