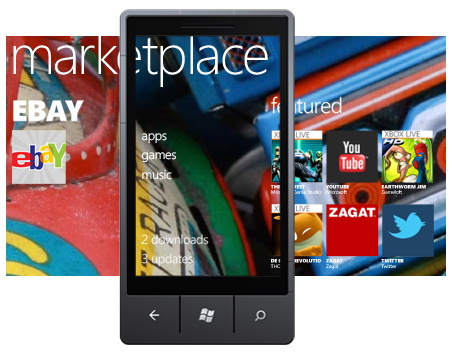
Mobile analytics firm Distimo has taken a look at Microsoft’s Windows Phone Marketplace one year after its launch in November 2010. Now available in 35 countries worldwide, the store has grown consistently in size and scope since its debut, at a rate of 700 new publishers added per month. But its app download volume, in comparison with market leader iTunes, is still quite small. In fact, it’s 39 times smaller relative to Apple’s App Store for the iPhone.
The Windows Phone Marketplace was initially available to 17 countries with 18 added later on.* Distimo’s report examines trends among all 35.
Today, Microsoft’s Windows Phone is being hyped as the 3rd major mobile ecosystem, with some analysts even predicting it will steal huge chunks of mobile market share away from Apple’s iPhone by 2015. However, in terms of its app store, it’s still the 5th largest in size, behind Apple, Android, BlackBerry and Nokia.

At its launch, 70% of the mobile apps in the Windows Phone app store were paid and this continued to be the case up until February 2011. At that point, the number of free apps began growing exponentially. By June, there were 900 more free apps than paid apps in the store. But the following month, Microsoft kicked out over a thousand free apps due to developer violations with regards to their policy on “app spam.” (According to Microsoft’s rules, a developer cannot publish more than 20 apps with similar functionalities per day.) Even with the crackdown, the number of free apps continued to grow again, and by October, there were again more free apps than paid ones in the store.
Distimo found that paid apps increased steadily over the past 12 months, with nearly 1,300 new apps per month, while free apps grew by 1,650 new apps per month. As is par for the course in other app stores, games are the most popular category of app for Windows Phone, too, whether free (33% of the top 100) or paid (54% of the top 100). (As of Oct. 2011)

However, when examining local markets, the free/paid mix isn’t always as consistent. For example, in the U.S. and Australian Marketplaces, 50% of the top 100 free apps are games. But in Brazil, South Korea, Norway and The Netherlands, games account for only 15% to 20% of the top free apps. Meanwhile, in the U.K and South Africa, games account for 64% of the top paid apps and in Brazil and South Korea only 10% of the top paid apps are games. This latter situation is likely impacted by those countries’ “notorious” game rating policies, says Distimo.
In terms of downloads, the U.S. leads, with 101,000 free app downloads and 20,000 paid app downloads per day (out of the top 300 most downloaded apps). Compared with the iPhone, though, these numbers are chump change – that market saw 43 times more free downloads and 16 times more paid downloads daily (also out of the top 300).

In addition, when calculating paid downloads, it’s important to note that paid downloads on Windows Phone include free trials. These types of “paid” apps account for 80% of the downloads, which means that only 4,000 downloads (out of the top 300 paid) are generating revenue in the U.S. Marketplace.
Outside of the U.S., the other top download spots include Germany, the U.K., France and Italy, which hold spots 2 through 5. Out of the more recently added countries, Japan has to largest download volume with 6,000 apps (in the top 300) downloaded per day.
Japan and the U.S. also have the most unique content in their stores, with 215 and 1,361 unique apps, respectively. Chile, Portugal, Colombia and South Africa have no unique content. For the most part, the overlap of free apps is lower compared with the overlap of paid apps. This holds true everywhere but Brazil and South Korea, Distimo found.

One not too pleasant finding: nearly half of the applications are only available in the original 17 countries. That means developers did not take advantage of the new countries when launching their apps or have not updated their older pre-Mango apps since the Mango 7.5 release, which brought the additional countries on board. That may be the most interesting finding of all, as it speaks to developer inertia in this app store.
For more details, the full report is available here.
* The first 17 countries were Australia, Austria, Belgium, Canada, France, Germany, Hong Kong, India, Ireland, Italy, Mexico, New Zealand, Singapore, Spain, Switzerland, United Kingdom and the United. The additional 18 countries added were Brazil, Chile, Columbia, Czech Republic, Denmark, Finland, Greece, Hungary, Japan, Netherlands, Norway, Poland, Portugal, Russia, South Africa, South Korea, Sweden and Taiwan.