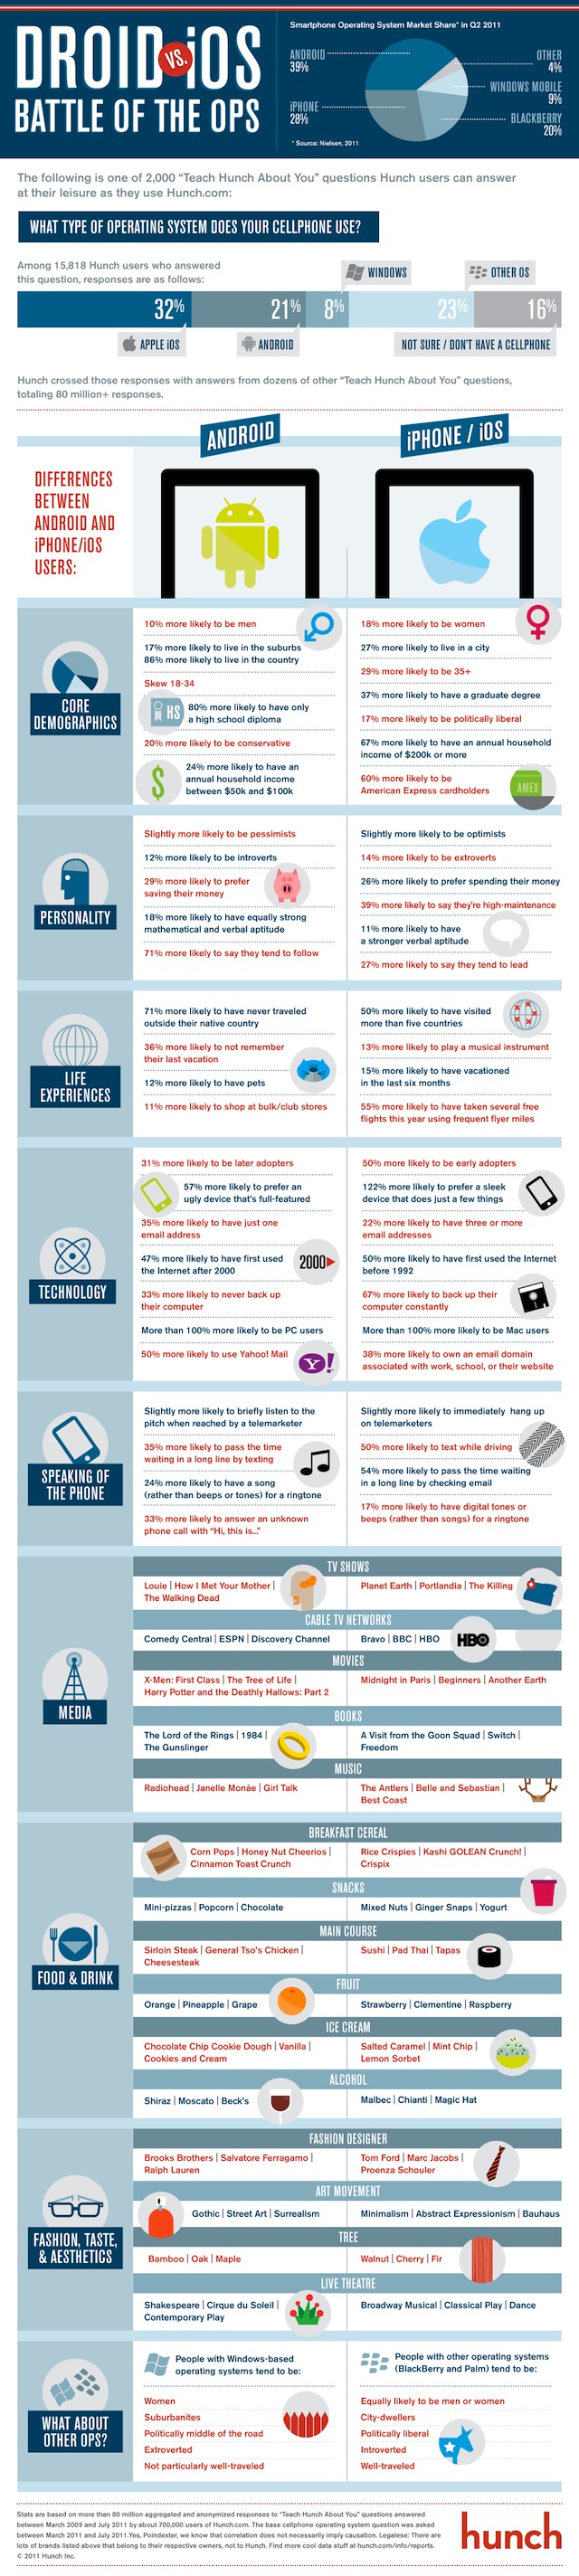
Ever wonder what’s the real difference between Android and iPhone users? According to Hunch, Android users are 10 percent more likely to be men, skew younger, and 20 percent more likely to be politically conservative. As you can see from the infographic below, they have good incomes, but iPhone users tend to have higher household incomes. Android users are also “slightly more likely to be pessimists,” introverts, and are 29 percent more likely to want to save their money.
iPhone owners are more likely to be optimists, extroverts, and are self-admittedly “high-maintenance.” They are 26 percent more likely to enjoy spending money on shiny objects. They also are 27 percent more likely to consider themselves leaders than followers and are 50 percent more likely to be early adopters. In contrast, Android users are 31 percent more likely to be later adopters and “57 percent more likely to prefer an ugly device that’s full-featured.” There is also a much higher chance Android users own PCs than Macs. Just sayin’.
How does Hunch know all of these correlations? The data is based on 15,818 Hunch users who have answered the question, “What type pf operating system does your cellphone use?” The breakdown among Hunch users is 32 percent Apple and 21 percent Android, which is the flip of more mainstream market stats such as Nielsen’s which puts Android smartphone market share at 39 percent in the U.S, and iPhone at 28 percent, but the sample size should be big enough to draw some conclusions about Android and iPhone users. (Or at least the ones who answer questions on Hunch).
What else does the Hunch data purport to know about Android and iPhone users based on how the same people answered 80 million other questions? Well, Android owners are 12 percent more likely to have pets and 71 percent more likely never to have travelled outside their native countries. Does that make them homebodies? The chances are much greater that iPhone users have traveled abroad and used some frequent flyer miles in the past year. Their breakfast cereal of choice is more likely to be Crispix or Kashi GOLEAN Crunch than Corn Pops. And they are more into sushi than steak.
Remember, these characterizations are based on probabilities and won’t be true for every iPhone or Android user. I, for instance, would much rather eat steak than sushi and guess what kind of phone I use most regularly. As we all know, if it’s in an infographic it must be true.