![]()
Google Analytics just got better. Google will begin rolling out a set of major upgrades today to the free Website measuring tool. The new features include the ability to create custom reports, better ways to look at audience segments, the ability to track and measure AdSense inside Google Analytics, an API (on it’s way), the introduction of cool bubble “motion charts,” and some user interface improvements. Let’s take these new features one at a time.
1. Custom Reports: Lets you create reports using any source of data (such as people who have bought something on your site, average number of pageviews, geography, visiting source) as the X and Y coordinates for a chart.
2. Audience Segmentation: Lets you look at custom slices of your Website’s audience (such as people who stay for more than two minutes, people who came from TechCrunch, people who came from the New York Times, people who bought something, people who came from Techcrunch and bought something).
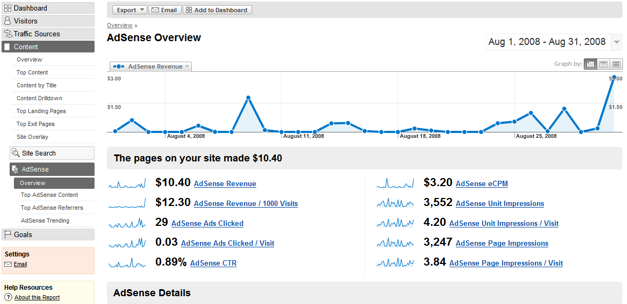
3. AdSense integration: This was along time coming. You can already track how your AdWords campaigns impact traffic to your site. Now you can see data from your AdSense account as well. Marry that with Google Analytics data and you can get new insights into not only which ads you place through AdSense are doing the best, but from which referring sites. (Read more on the AdSense blog).
4. API: This will be rolling out “soon,’ but is also being announced today. Google will open up an API to Gogle Analytics that will allow developers to pipe all of the data in Google Analytics to other Websites, tools, widgets, or even mobile apps. So if someone wants to create a widget that will let people show their Google Analytics charts on their blog, that will be possible.
5. Bubble Charts: The new motion charts allow you to visualize data across five dimensions (x axis, y axis, size of bubble, color of bubble, and position over time). It lets you create an animation to show you what’s been happening with your Website’s key metrics. This feature comes out of the Trendalyzer software Google bought from Gapminder in 2007. (See video below).
6. User Interface Tweaks: You’ll notice some new subtle shading and highlighting. But the biggest change will be in the management dashboard. Now, if you track more than one Website with Google Analytics, you will be able to see trends across all of them at once.
Below is a video of the new “motion charts,” which let you track data across time. You can find more videos showing off these new features here.