
We are currently witnessing a shift in business models, as many consumer tech companies move from transactional models in favor of subscription-based ones. YouTube is launching an ad-free, subscription-based service. Apple recently launched a streaming music service for $10/month. Microsoft just bundled its popular consumer products into a $199/month offering as cloud services have become a critical part of the company’s turnaround strategy.
Many of our other favorite consumer services, such as Netflix, Spotify, Slack and Dropbox, operate on a subscription-based model — and have experienced stellar growth. Even upstarts like Dollar Shave Club and Blue Apron Labs have applied this model to delivering physical goods and have raised capital at massive valuations.
If you operate under a subscription model, how do you go about measuring success? Below is an overview of the key inputs and outputs you should track closely.
Monthly Average Revenue Per User (ARPU); Also Known As ARPS, ARPA
Monthly Subscription ARPU = Subscription Revenue / Average Subscribers
This metric is the average subscription revenue generated per user each month. The easiest way to calculate this metric is to take the revenue generated from subscriptions and divide it by the average number of subscribers over that period.
Monthly Subscriber Churn Percent
Monthly Subscriber Churn Percent = Subscribers lost in month / Base of subscribers at beginning of month
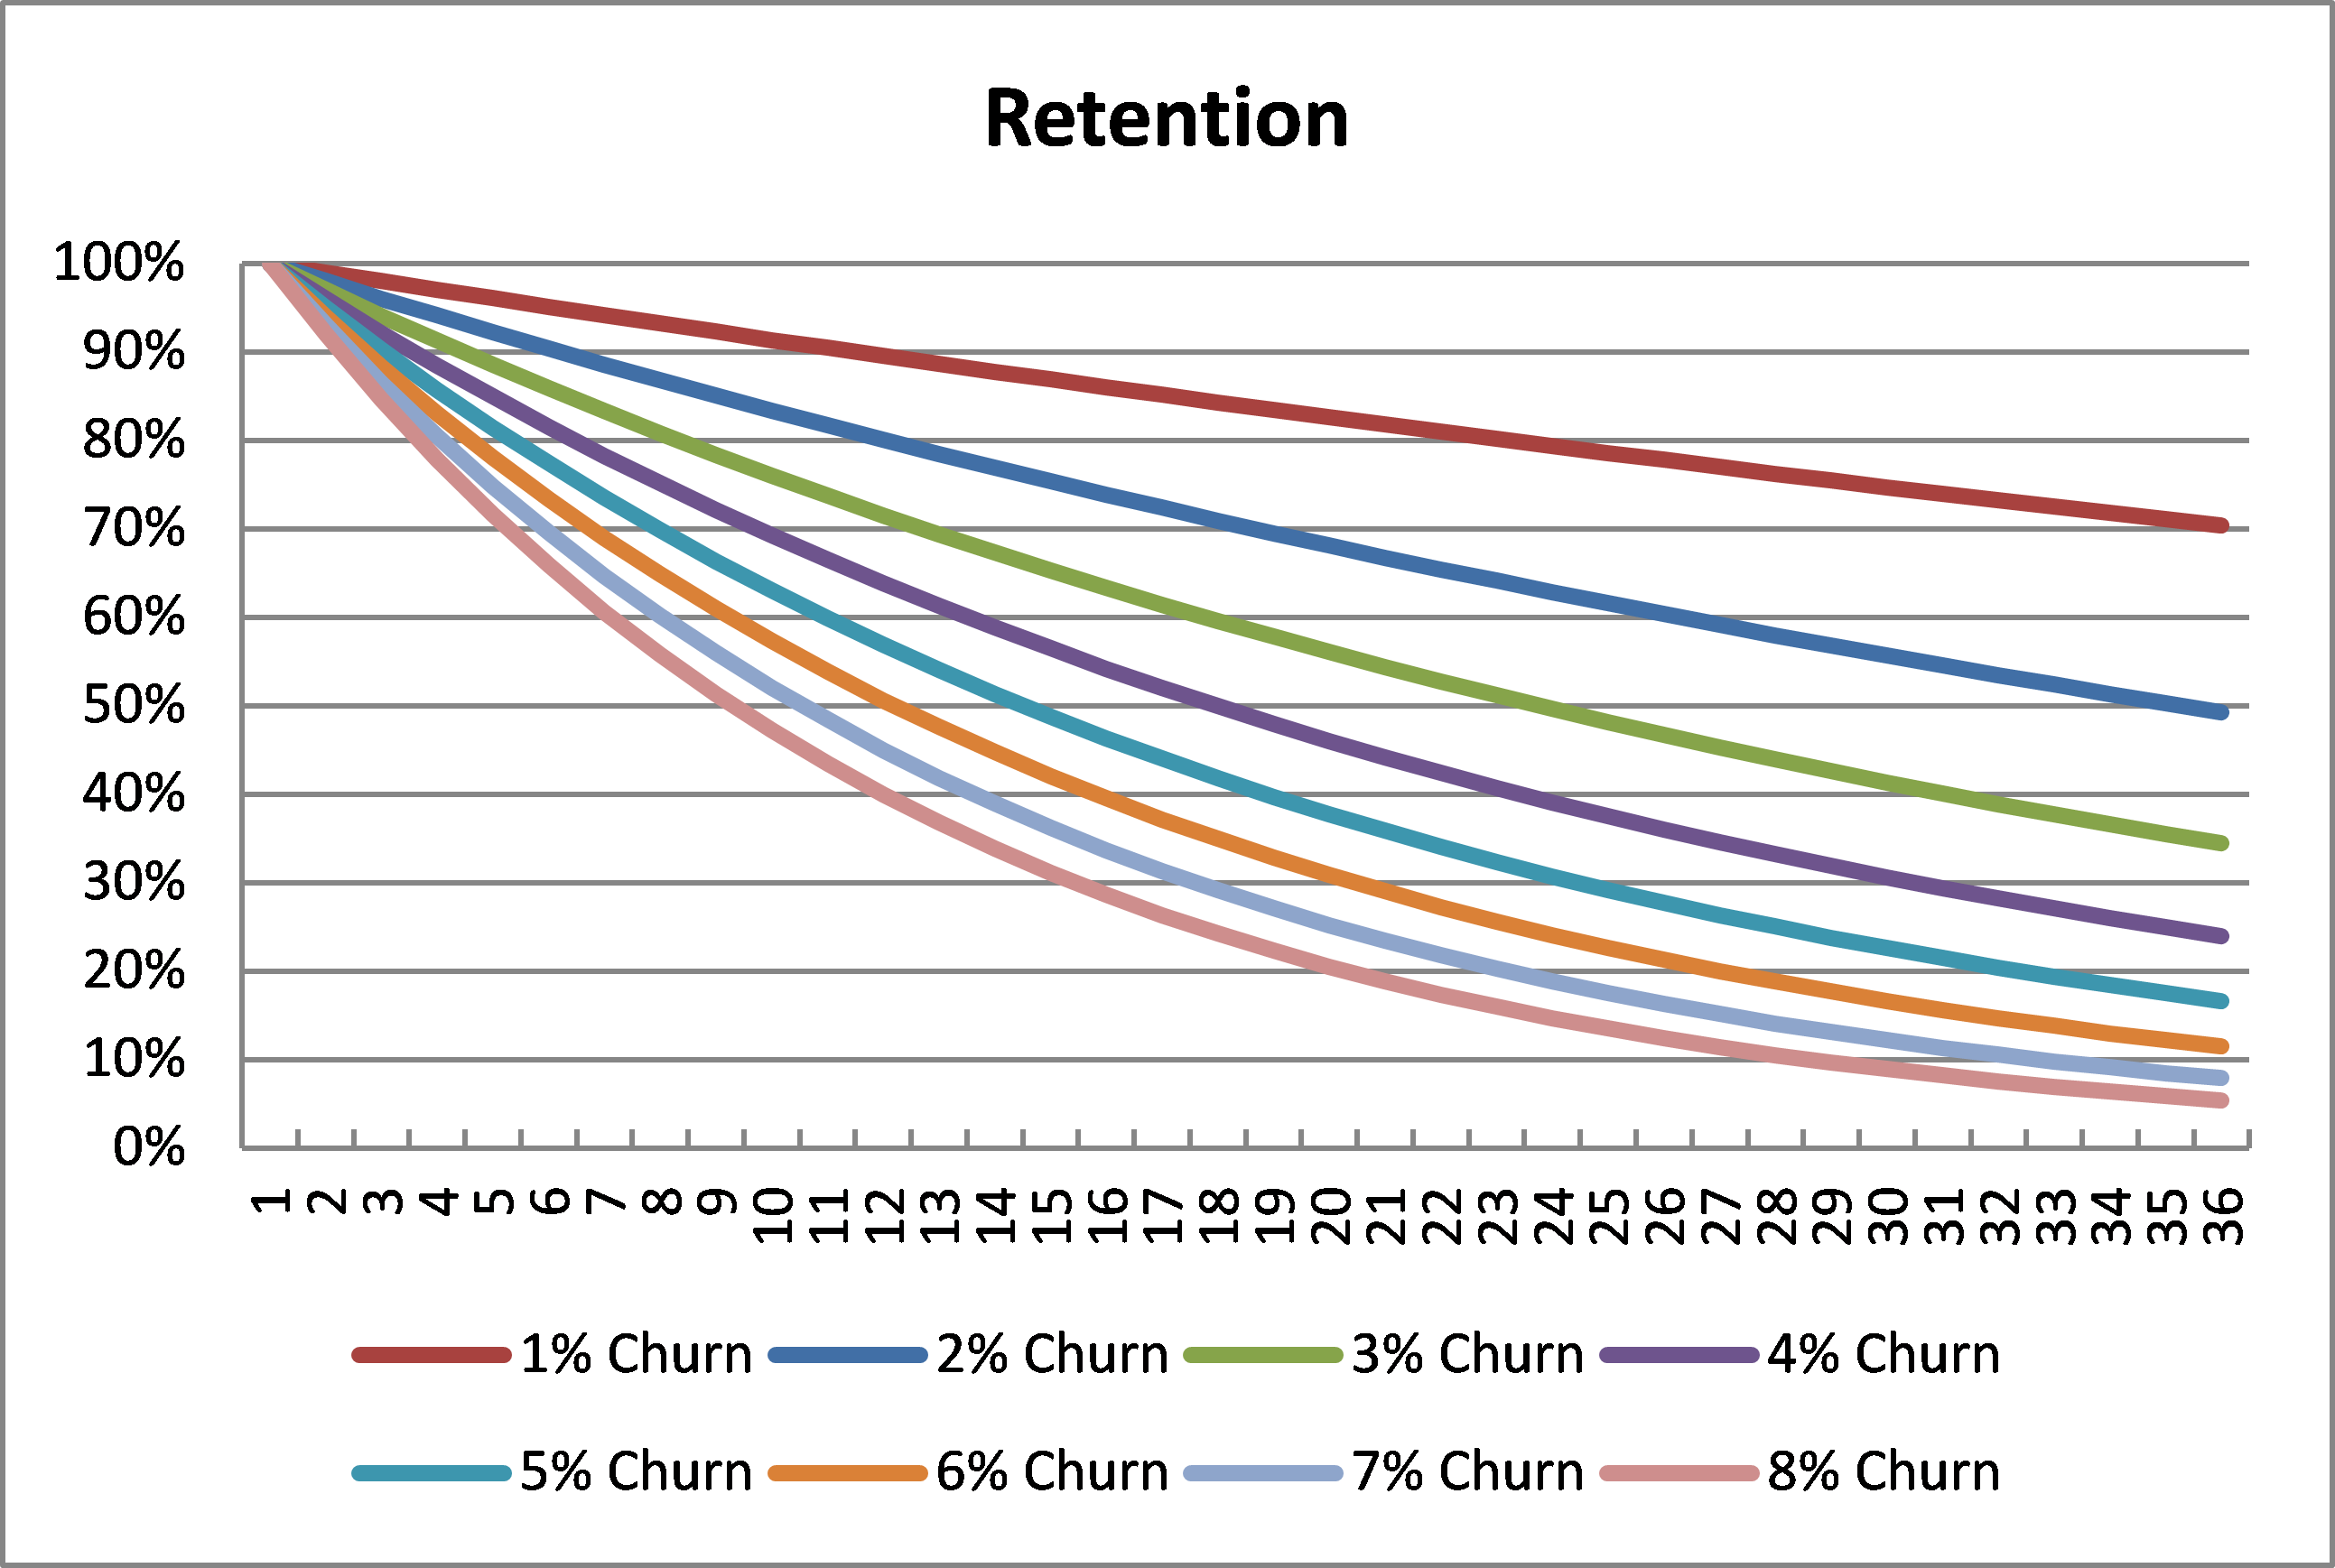
A major driver of lifetime value in a subscription-based model is monthly subscriber churn. It cannot be overstated how important churn is as a metric. After 36 months, a company with 1 percent monthly churn will retain roughly 70 percent of its customer base. On the flip side, a company with a 6 percent monthly churn will only retain 11percent of its customer base.
It is difficult (and expensive) to build a large subscriber base if your customers are regularly leaving. Try to create competitive moats that differentiate your service from others. By doing this, you will have a stronger value proposition and customers will likely stick around longer.
According to research analysts, Netflix has dropped its monthly churn to 3 percent, down from record-high churn rates of 5-6 percent several years ago. The reason churn has dropped is likely because of the company’s investment in an improved content portfolio and steady slate of originals.
A healthy monthly churn rate for a high-quality consumer Internet business is between 2-4 percent. If you are above this range, talk to your customers and figure out what they like/dislike about your service. Ask outgoing customers to explain why they cancelled. There is a difference between customers who cancel because they don’t like your service, because they can’t afford it and because their credit cards expired.
Gross Margin Percent
Gross Margin Percent = Gross Profit (from subscribers) / Subscription Revenue
Gross margin measures the percentage of revenue the company retains after accounting for all the direct costs associated with making a product or providing a service. This is important because it directly impacts the profitability of your business. Many SaaS businesses have high gross margins of 70-80 percent, which leads to a higher LTV and gives more flexibility on how much can be spent on customer acquisition. Companies like Netflix and Spotify, with significant content costs, have lower gross margins and thus less flexibility.
Subscriber Lifetime Value (LTV); Also Known As CLV, TLV
Subscriber LTV = (Gross Margin Percent * Monthly Subscription ARPU) / Monthly Subscriber Churn Percent
Lifetime value is simply the dollar value of a customer relationship. It is the future profit you expect to earn from a customer throughout his or her relationship with the business. Defining lifetime value is incredibly important because it represents the upper limit on how much you can spend to acquire new customers. As in our example above, monthly churn significantly impacts the lifetime value of our users. Assuming a $9.99 monthly price-point and 50 percent gross margins, with 6 percent monthly churn we have an $83 lifetime value and with 1 percent churn we have a $500 lifetime value. This is a massive difference.

Companies often mistakenly calculate lifetime value without factoring in gross margin. By doing so, you would be overstating your lifetime value and potentially overspending to acquire customers. If you are calculating it this way to impress investors, well, they won’t be fooled!
Customer Acquisition Cost (CAC); Also Known As CPA, SAC
Customer Acquisition Cost = Sales & Marketing Expenses / Gross Customer Additions
CAC is the cost associated with convincing a customer to buy your product or service. There are many different ways to calculate CAC, but the recommended method is to take all your sales and marketing expenses and divide it by the total gross number of subscribers added in the specific period you are measuring. If you have different revenue lines, such as advertising, make sure to isolate and include only the costs related to driving new subscription revenue. If you have costs related to retention of existing accounts, you can exclude them for this calculation.
When you can measure what you are speaking about, and express it in numbers, you know something about it, when you cannot express it in numbers, your knowledge is of a meager and unsatisfactory kind. William Thomson, 1st Baron Kelvin
Most consumer businesses will have a majority of customer acquisition spend come from paid marketing. And there are many different online acquisition channels: Google, Facebook, Twitter, Affiliate, SEO, SEM, Email, Blog, PR, Referral, Free tiers (if you have a freemium model), etc. As you run your business, track lifetime value and CAC across every channel.
Test and see which channels are more viable than others. Certain channels will be more expensive, but may source high-quality customers. Others will be cheaper, but may source low-quality customers. Don’t measure LTV and CAC in isolation, but together. The limit on how much you should be spending on CAC is your customer lifetime value. If you are spending more than what your customers are worth, then you are running an unprofitable business.
Once users reach your website, your CAC will be directly tied to your ability to convince them to purchase a subscription. Investing in funnel design and A/B testing is critical, as simple tweaks can increase your conversion rates (and decrease acquisition costs) significantly. Here are some questions to think about that may impact your conversion rate:
- If you run a freemium business, is your free tier too strong in relation to your premium tier?
- If you have a premium-only product, does it help to offer a 7- or 30-day trial? Which sees higher conversion?
- When should you ask a subscriber for credit card information? Before or after the trial?
- Should you bill through the app store and pay the platform fees?
Payback
One of the major outputs you should track closely is time to payback, which is the number of months it takes to recover your upfront acquisition costs. Investors love this number because it is an overall measure of the efficiency of your subscription business.
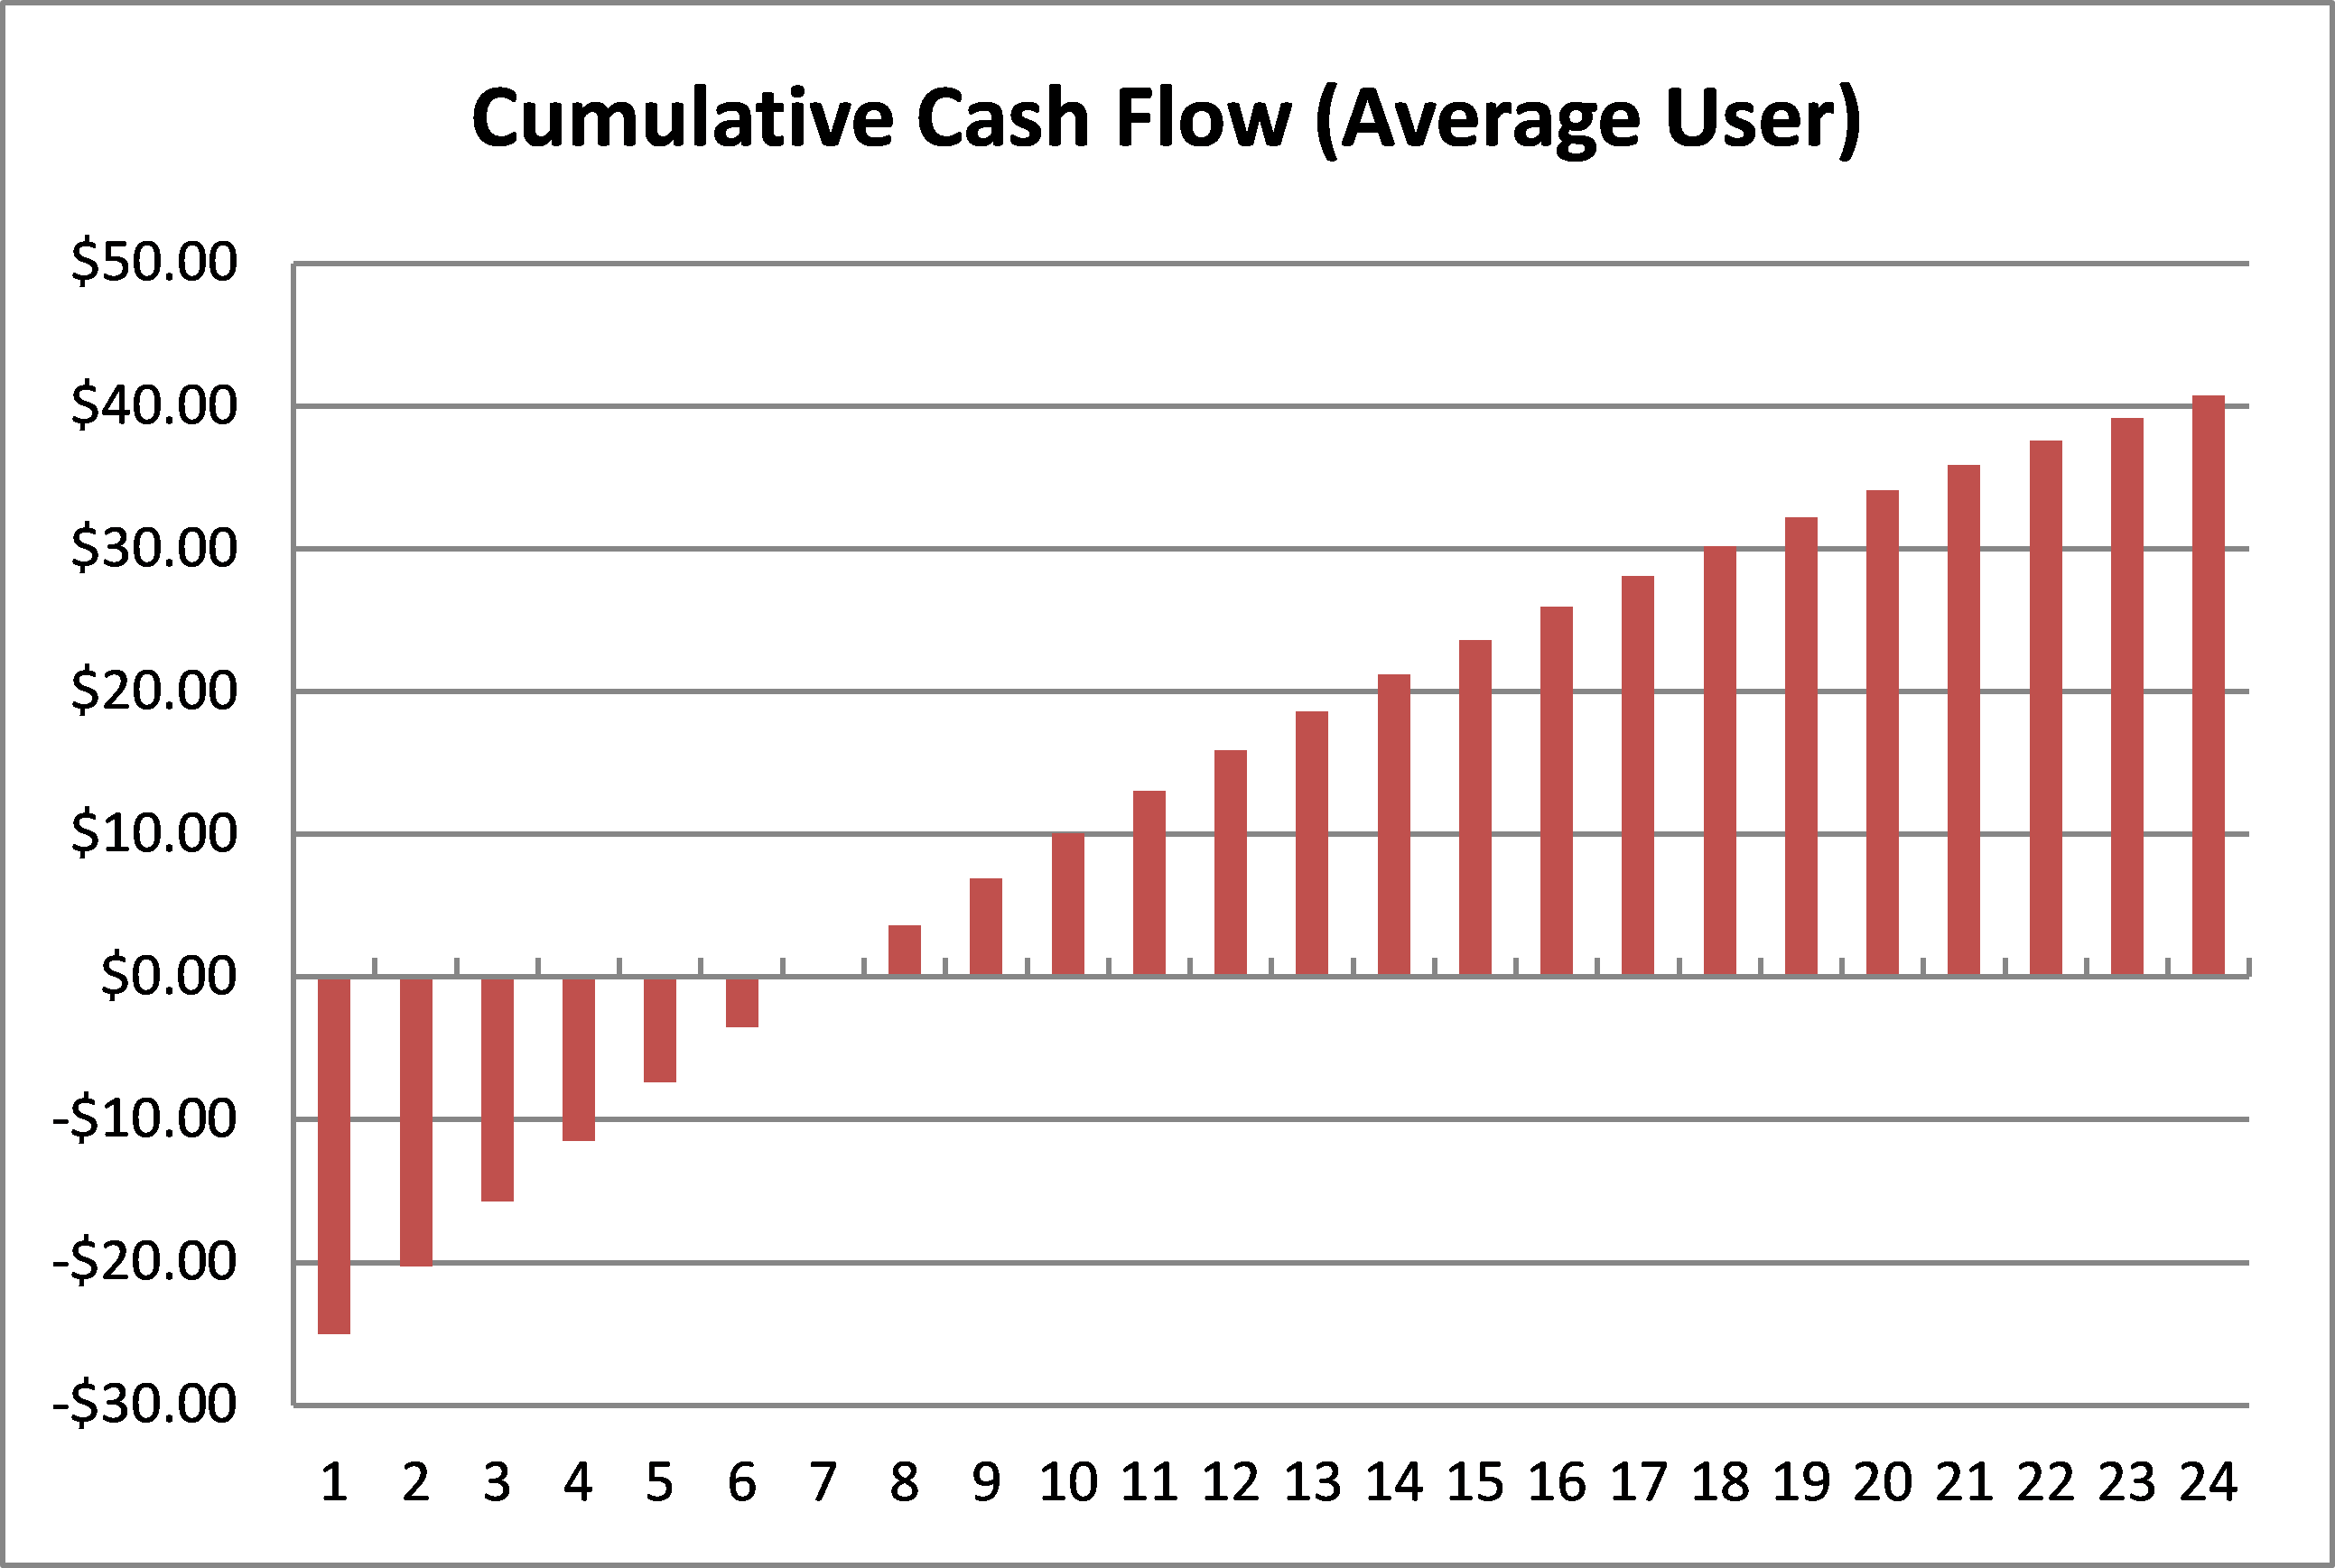
A general guideline is to keep payback under 12 months. In the example below, we can see the cumulative cash flow and payback for an average user. We assume it costs $30 initially to acquire an average user. In each month (including month 1), users contribute cash flow to offset these costs. The chart shows that an average user becomes profitable in month 7.
The longer the payback time, the more capital will be required to grow your business. Imagine if it took 24 months to receive payback on an average subscriber. If you invested $10 million into acquiring a bunch of these users, you would have to wait 24 months before you received the $10 million back (assuming they paid monthly), and even longer to receive any potential profits. During these 24 months you may have other initiatives that also require investment, meaning you would likely need to raise more capital or push out some of your other growth plans.
Subscriber Return On Investment (ROI); Also Known As LTV / CAC Ratio
Subscriber ROI = LTV / Customer Acquisition Cost
Another major output you should focus on closely is subscriber ROI or LTV / CAC ratio. The best subscription businesses have a ratio that is above 3.0x. This means that if you invest $10 million, you would eventually receive $30 million of cash back. If this ratio is less than 1.0x, this means you are spending more to acquire customers than they are worth (Hint: You won’t be in business long…). It is also important to review this ratio along with payback time. There is a difference between a 3.0x ROI with payback of 7 months and 24 months.
Let’s review a few examples that put together all we have learned. We’ll take our four key variables (ARPU, Monthly Churn, Gross Margin Percent and CAC) and use them to understand how profitable our subscribers are.

Base Case. Our subscriber ROI is 3.3x with payback of 7 months. This is attractive! Within 7 months we recover our $30 investment and more than triple that investment during the user’s lifetime. Now let’s see what happens if we tweak each of the main variables.
Increase Churn. We increase churn from 5 percent to 8 percent, which significantly decreases lifetime value from $100 to $62. This stretches out our payback by one month and decreases our subscriber ROI to 2.1x.
Decrease Gross Margin. We decrease gross margin from 50 percent to 30 percent, which drops our lifetime value from $100 to $60 and doubles our payback time to 14 months. Subscriber ROI drops by almost half, to 2.0x.
Increase CAC. We increase CAC from $30 to $50, which doubles our payback time to 14 months and decreases subscriber ROI to 2.0x. While LTV in this example is higher than in the previous example, our subscriber ROI is the same in both cases. This is because our acquisition costs have also increased significantly.
Are you interested in understanding how these metrics impact your business? If so, download the lifetime value model I created here and tweak the assumptions to your liking.
If you haven’t yet launched your subscription business or product line, this is a good model to get you started. While it is difficult to know the exact data before you launch, estimate for now, and do your best to figure out each metric as soon as possible. If you are already running a subscription business, input your metrics into this model and use the sensitivity tables to figure out how to increase your ROI.
Make sure to create different models for different product lines, acquisition channels and geographies. Investors will be running these calculations when you are fundraising, so it is important to make sure you have a handle on them, too. Good luck!