
The last thing I recall thinking about C3.ai (C3) was seeing its billboards outside San Francisco and asking myself what the hell the company actually did and how much it was spending on huge outdoor advertisements.
So much for what I know. The company filed to go public on Friday, and instead of being a cash-burning, buzzwordy mess, C3 is actually in pretty good financial shape, generating both growing recurring software revenues and cash in some quarters.
The Exchange explores startups, markets and money. Read it every morning on Extra Crunch, or get The Exchange newsletter every Saturday.
C3’s growth is not as regular as some investors might like, but the company has an attractive gross margin profile and even the occasional bit of net income to point to. Its financial picture is therefore generally likable, with a few caveats that we’ll explore.
 But what does C3 do, who backed it, and what can we learn from drilling into its numbers? I am glad you asked, because those were precisely the questions that I had going into its filing.
Pull up the document here, and let’s get into the numbers.
Inside the guts of a modern AI company
First, what is C3? The former startup calls itself an enterprise artificial intelligence (AI) company, selling software services that help big companies build AI apps “of extraordinary scale and complexity that offer significant social and economic benefit,” according to its S-1.
The company sells its software in two forms: as a developer environment that lets customers design, build and deploy their AI apps on their cloud of choice, and as a group of pre-built apps users can spin up quickly. If C3 were a startup, I’d ask at this point how efficacious its AI tooling really is, but as this unicorn is worth $3.3 billion and has nine-figure revenue, it must have come up with something that works.
A host of venture capital firms have invested in C3, with the company raising more than $360 million during its lifetime, according to PitchBook data. BlackRock led its Series H, FS Investors led its Series G, its $100 million Series F was led by TPG, Breyer Capital led its Series E, TPG Growth led its Series D, while its Series C and before are a little harder to parse, but it appears that Makena Capital Management and Interwest Partners were active at that stage.
Looking to ownership, founder and entrepreneur Thomas Siebel owns just under 34%, TPG owns 22.6% and Baker Hughes owns around 15%. The company’s voting power rests in its Class B stock, which Siebel effectively controls.
Right now, is the business itself any damn good?
The numbers
C3 has an annoying fiscal year, a twelve-month period that ends on April 30. So, when we discuss its most recent two fiscal years, we’re chatting about the four quarter periods that ended on April 30, 2019 and April 30, 2020. Afterward, we’ll drill into the July 31 quarter, the most recent period for which we have data.
In those two fiscal years, C3 grew its revenue from $91.6 million to $156.7 million, a change of 71.1%. That’s great growth at scale. However, like most unicorns, C3 lost more money as it grew, seeing its fiscal 2019 net loss of $33.1 million more than double to $69 million in the April 30, 2020 fiscal year.
Those net loss figures are not great, but they are also not catastrophic for a company that is growing as rapidly as C3. And, in its most recent quarter — the three months ending July 31, 2020 — the company actually posted GAAP net income of $150,000, up from a loss in the same period of 2019 of $323,000.
Before we drill into its most recent quarter, let’s discuss revenue quality. From 2018 into the first quarters of 2019, C3 had blended gross margins in the 60s. Then, starting with the July 31, 2019 quarter it jumped into the mid-70s, where it has stayed since.
C3 breaks out its services revenues, which means we can see only its gross margins on its software incomes. Those have risen from the mid-70s to the high-70s, peaking in the April 30, 2020 quarter at 81% before dipping 200 basis points in the most recent period. Still, C3 can point to generally improving gross margins as it scales. That’s good.
Its scaling is a sticky wicket, however, as the company tends to see its revenue grow in chunks. To illustrate that, I have a chart for you. I try to avoid sharing the marketing faff from companies’ S-1 filings when we peek at them, but in this case it’s useful.
Heres C3’s revenue growth over time:
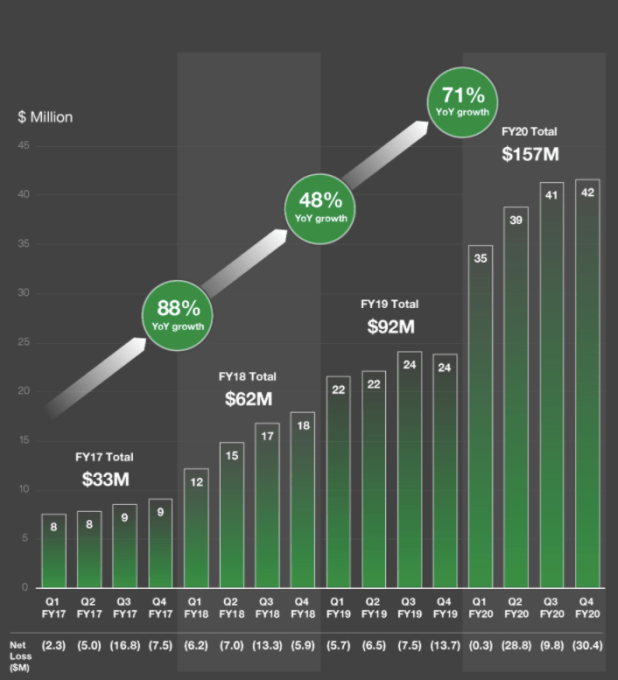
Image Credits: C3.ai
Weird, right, for a SaaS company?
Revenue was mostly flat in its fiscal 2017, 2019 and has leveled off once again. Only its fiscal 2018 saw consistent sequential revenue expansion of the sort that we usually see from modern software companies. Fiscal 2020 was better than most years when it came to sequential growth, but expanding from $39 million to $42 million in two quarters is not amazing.
And then, there’s the twist. Q4 2020 is the April 30 quarter, recall. And we have data for the July 31, 2020 period. So, what happened then? C3 shrank to revenues of just $40.5 million. Whoops.
Now, the company is only showing full fiscal years in the above chart, so I am not going to castigate it for not including that pesky revenue decline, but the drop in top line — which C3 says was “primarily driven by a decrease in subscription revenue of $3.6 million due to the Baker Hughes contract modification that occurred during the three months ended July 31, 2020” — is somewhat ugly, possibly denting public investor enthusiasm for C3’s near-term growth strategy.
Regardless, C3 does not need money. Between short-term investments and cash it has more than a quarter billion in liquidity, or around four years’ worth of burn at its fiscal 2020 pace. The unicorn, then, is going public because it wants to.
We don’t know yet where it will price, but with a run rate of around $160 million and a valuation of $3.3 billion to defend, C3 will have to target around a 20x revenue multiple to just defend its valuation. It will have to do even better to best that figure.
More when we have it.