TechCrunch recently dug into Atlassian’s IPO deck, detailing how the company prepped the document and took it on the road. It’s worth your time. Read it.
It’s always interesting to dig into a company’s IPO documents and decks after they’ve debuted, as with the benefit of passed time we can learn quite a lot. This is especially true in the case of Atlassian, a company that has seen its share price multiply since its 2015 public offering; outliers are always more interesting than pedestrian results, and Atlassian’s IPO-era materials are fascinating.
In this companion post we continue our dive into the firm’s IPO deck, this time parsing the document from a financial perspective. Ron got the first-person story and the context; here we’ll dig into the company’s reported financial results, with a focus on how well-prepared to grow and profit the firm appeared at the time of its public offering.
To keep this entry from skating into long-read territory, we’ll focus on three financial elements of the firm’s deck that stood out as TechCrunch reviewed it: The company’s history of efficient growth, its customer loyalty and its intriguing cost structure. Each facet is related to the others, but our three themes will help us understand why Atlassian has managed the valuation appreciation that it has since going public.
You could see its later success at the time of its IPO, if you knew where to look.
Broad strokes
Before we dig into the specifics, let’s ground ourselves.
Atlassian’s deck detailed a quickly growing software business. In its fiscal 2013, the company generated $149 million in revenue. That figure rose to $215 million in 2014, and fiscal year 2015 saw a total of $320 million in revenue.
This revenue growth was built on the back of customer growth; Atlassian noted in its deck that between its fiscal 2010 and fiscal 2015, it grew its customer base on a 34% compounding annual growth rate. Not bad.
So, we’re examining different parts of a high-growth software business. With that, let’s get specific.
Efficient growth
Atlassian is a SaaS business, meaning that it sells access to its software for a regular fee. This is now the standard way software products are delivered in most of the world. But while the SaaS model has become the norm generally, Atlassian’s results at the time of its IPO still stand out.
Why? Because while many modern SaaS companies generate more cash as they scale, Atlassian did not. In fact, if we parse its deck, we see the opposite. Here’s slide 45:
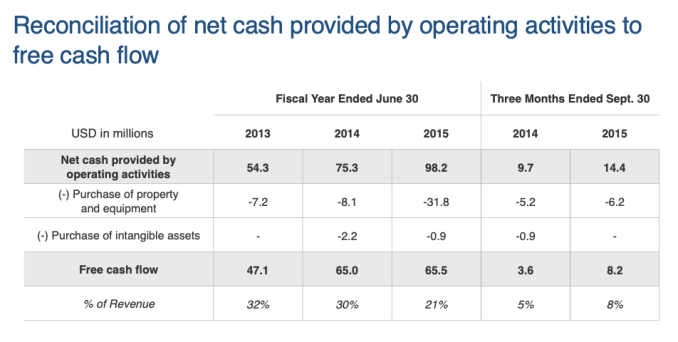
That’s a lot of boring numbers, so let me help.
Check the line marked “Free cash flow.” Follow it left-to-right. We’re moving forward in time, and you’ll see the number rise as you keep reading. The pace of growth slows, however. We can see that Atlassian’s free cash flow only grew by a hair in its fiscal 2015. That’s less than great, but we can also see in the final two columns that the company’s most recent quarter at the time of its IPO crushed its year-ago free cash flow result.
Free cash flow growth slowed in Atlassian’s fiscal 2015, but the September 30, 2015 quarter (Q1 fiscal 2016) showed that there was more growth to be had.
Free cash flow is a company’s operating cash flow (the amount of cash that a company’s regular operations generate or consume in a period of time), minus capital costs of equipment and property purchases. The more free cash flow a company has, the better, as the result implies that the business can self-fund and doesn’t need to ask anyone for money.
To provide a bit of contrast, let’s peek at Slack, a great company according to investors both private and public. It was growing a lot, and they valued that. But if we return to Slack’s own IPO documentation, we can see (page 12) that it had free cash flow of negative $97.2 million in the most recent fiscal year it reported.
That’s very different, and it goes to show just how strong Atlassian looked when it was going public.
Customer loyalty
Atlassian spent a lot of time explaining in its deck how its customers tended to spend more money on its products over time. This is now bog-standard in SaaS and software, but as Atlassian went public in 2015, it had a bit more education to do.
We can’t highlight every slide in the deck that notes customer spend expansion, but slide 25 is pretty good at illustrating how Atlassian had grown over time. And it’s done in simple enough graphics that even bankers could grok it:
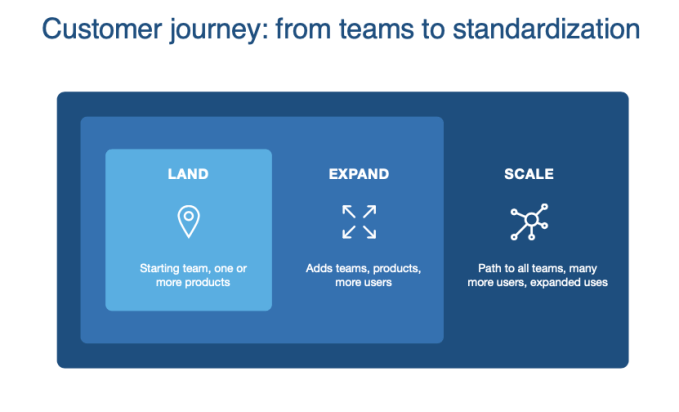
That slide is well and good, but what matters for Atlassian is that the data it shared backed up its claim that once it lands a customer, it sees more spend from that account. Indeed, far earlier in the deck (slide 6), Atlassian claims that a customer’s “cumulative 5 year customer spend” goes from $1 to $8; that’s pretty good!
The firm also gave examples from two customers (slide 30), and showed how different products can accrete more revenue over time (slide 28).
This land-expand stuff isn’t window-dressing. It matters. Remember, Atlassian was growing its customer base by more than 30% annually, on average. Each time it added a new year’s worth of customers, those accounts began to — on average — expand. That meant that the company had pre-baked a lot of growth into its business, even before it went public.
Investors buying its IPO shares were effectively wagering that the company’s customer base would keep buying more of its products over time, as a lot of its expected growth was tied up in those upsells.
Future-focused costs
When we started examining Atlassian we noted its rapid growth. The company was stacking lots of new revenue with each passing fiscal year. How was it doing that? Well, we know from its free cash flow results (positive) that it wasn’t spending all the money in the world.
Instead, as slide 38 details, the company’s various customer cohorts were growing over time:
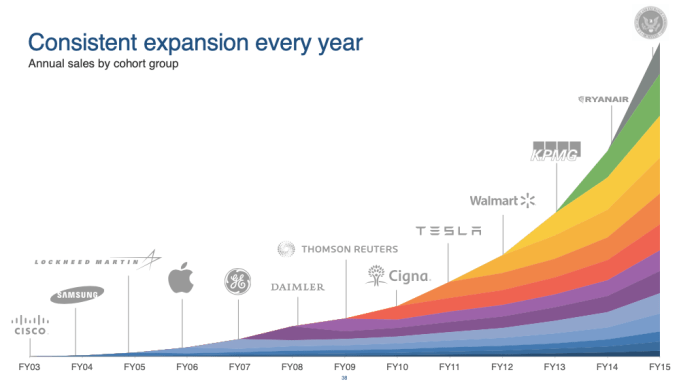
This raises a fun question. If Atlassian wasn’t spending all its money on sales costs, and was generating lots of cash, what was it spending all that money on?
This:
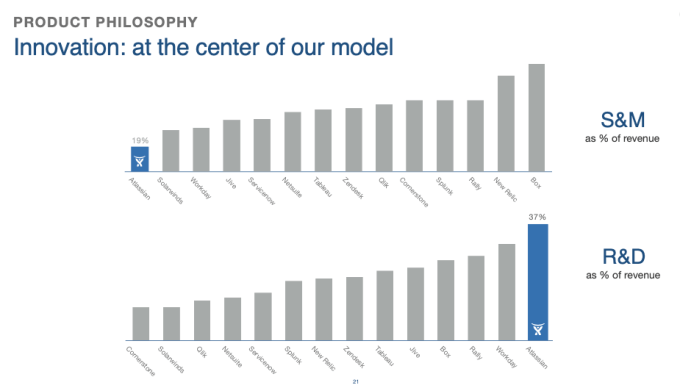
This chart showing how Atlassian was super-heavy on R&D spend completes our circle: Atlassian grew quickly when it was going public, and it did so in an efficient manner. It was able to grow so quickly and efficiently because customers liked its products and spent more money on them over time. They did so in part because the company spent more than its peers on building better stuff (R&D spend). And as Atlassian built better stuff, it could land more customers, starting the cycle all over again.
This means that the company could keep sales costs low, R&D spend high and continue to grow while generating more free cash flow.
Given our read of the deck, we’d expect the company to have put in some big growth since its IPO while generating oodles of cash. Let’s check the tape, pulling fiscal 2015 from its S-1 filing, and the rest of the results from earnings:
- Fiscal 2015: $319.5 million in revenue, $65.5 million in free cash flow
- Fiscal 2016: $457.1 million in revenue, $95.3 million in free cash flow
- Fiscal 2017: $619.9 million in revenue, $183.3 million in free cash flow
- Fiscal 2018: $874.0 million in revenue, $281.2 million in free cash flow
- Fiscal 2019: $1.2 billion in revenue, $422.2 million in free cash flow
Just as we expected.
Those data points explain the company’s post-IPO price appreciation, of course. And as we’ve just shown, you could see the seeds of that success back in mid-2015 as the company prepped to go public.