
There has been a lot of discussion about startup valuation over the past few months. Luminaries across the industry have chimed in, suggesting we’re returning to a time of irrational investment valuations hearkening back to the bubble of the late 90s.
My colleagues and I at Sapphire Ventures are seeing the rise in private market valuations firsthand. The stage at which we invest, the growth stage, seems to be experiencing this shifting environment most directly.
But at Sapphire, we’re very data driven, and know that rising prices are often justified. So we’ve been trying to tease out whether there are rational explanations for our current situation, or whether irrational exuberance is the only justification.
To explain why rising private market valuations might be justified, we needed to explore why the market today may be different than ever before (there are a number of good articles testing out the rationality of public market valuations in technology these days — this analysis is much more directly focused on teasing out the rationality of asset prices for those companies that aren’t valued and revalued on a daily basis).
We categorized all our potential explanations into three buckets and struck out to test them against real data. If the explanations proved true, we could begin to understand the increasing valuations we are seeing.
The three explanations we looked to test were whether:
- Companies are getting big faster
- Companies are getting big more efficiently
- Winners are easier to pick ahead of time
Explanation 1: Companies Are Getting Big Faster
In today’s Internet-dependent world, it’s easy to believe that technology companies are just getting bigger faster than before. We have plenty of anecdotal support in “rocket ships” such as Facebook, Slack and Uber, companies that rocketed past multi-million dollar revenue thresholds in months.
But anecdotes and reality are quite different. To test our hypothesis, we set out to examine the market as a whole, beyond just the companies like Facebook that we all anchor our thought processes against. So we pulled all available revenue history for any company that has traded publicly in the IT and software spaces. It was a lot of data.
Then, we looked at two data points – the year each company passed $300 million in revenue (we adjusted for inflation to 2014 dollars, finding 403 companies that met the criteria from 1999-2014) and the age of the company at that time.
We suspected that by the time most companies reach $300 million in revenue, they typically have a few years under their belt in the public domain, so we felt that this was a good threshold. But we know we missed certain outliers, like Facebook.
With those two data points, we could compare how long it took companies to grow. We expected to see the average age of companies passing the $300 million revenue threshold to be dropping. We didn’t.
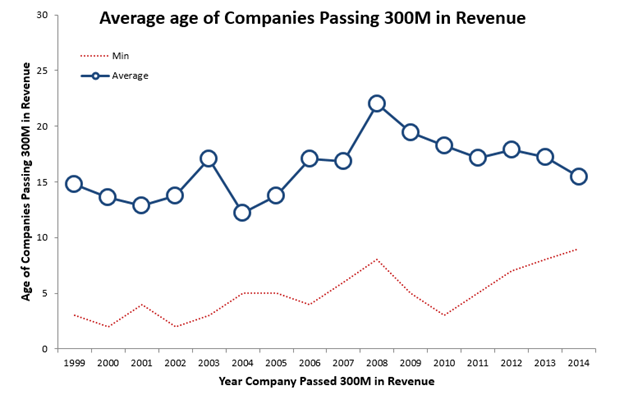
Source: S&P Capital IQ accessed June 2015, Sapphire Ventures Analysis
Instead, we found that the companies passing $300 million in revenue — on average — didn’t change much over time. The data saw the average age of companies passing our revenue hurdle hover around 15 years, with no discernible trend. Even when you only looked at the fastest-growing companies in each year, there was no real trend.
Admittedly, our data set was inherently limited. We don’t have access to revenue information for companies that stayed private beyond our threshold. But the data did contain a sample of more than 400 technology firms.
While some missing rocket ships might change the average slightly, our results were probably a lot more indicative of the average company out there fundraising today.
Who knows what explains the pattern we observed. Maybe it was easier to scale revenue faster when you could recognize everything up front with a perpetual license. Maybe there was just less competition. Maybe Moore’s Law is creating price compression today.
We couldn’t glean an explanation from the data. But despite how you looked at it — and despite all the anecdotes we’d heard — the data didn’t confirm that companies were getting big faster.
Explanation 2: Companies Are Getting Big More Efficiently
Even if companies aren’t growing faster than two decades ago, capturing their revenue with more efficiency would make them more valuable. All else equal, we’d all pay more for a car that requires 1 ounce of gasoline to go 300 miles than a car that requires 10 gallons to go the same distance.
It’s a sensible explanation. It’s cheaper than ever to build a product. AWS, cloud platforms and a plethora of open-source libraries are allowing applications to be built at a fraction of the cost of the 90s. But starting up and building a company are different things. Building a company of scale requires a sales force, high levels of recruitment, marketing within a crowded marketplace and a whole variety of other challenges.
We had to go back to the data. To test our hypothesis on capital efficiency, we turned to CrunchBase and examined how much capital companies were raising per year of operations.
We looked only at companies that were at least five years old and had raised at least a Series B. Our assumption is that this threshold would eliminate the young companies that become irrelevant quickly or turn into lifestyle businesses for their founders.
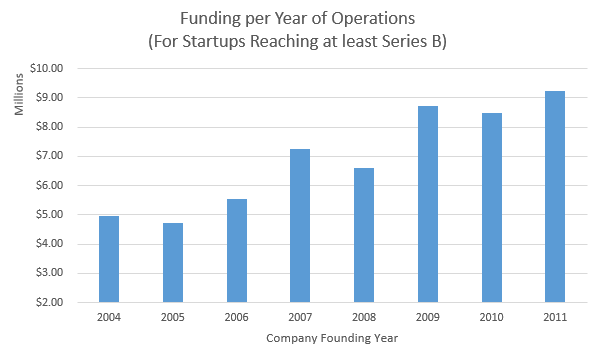
Source: CrunchBase data accessed March 2015, Sapphire Ventures Analysis (adjusting for acquisition dates). Due to differences in when cash was contributed to different startup companies, these numbers were not inflation adjusted.
The numbers again told a story that was different than we’d expected. Instead of diminishing fundraising per year, we saw companies raising more and more per year of operations.
There are plenty of explanations for this. As a former entrepreneur, I know that it can make all the sense in the world to put money into a war chest while you can. But from an investor’s perspective, more capital per year of operations is indicative of increased dilution, increased cost of entry and changing preference stacks.
These all could be great investments, but the data here suggests that (at least from your investors’ perspectives) it’s not cheaper than it’s ever been to build a big business.
Explanation 3: Winners Are Easier To Predict
Facebook reached a million users in less than a year. Uber became a household name in just a handful of years. WhatsApp had 400 million users in fewer than five. In a world where the tech press help companies achieve escape velocity faster than ever, maybe it’s easy to call the winners earlier and earlier.
With more predictable winners, there would be fewer failures in the market and more dollars chasing fewer assets. The 100x investments that VCs required in the past might be much lower in a world where, instead of 1 out of 10 companies succeeding, 5 out of 10 companies did.
To examine this last hypothesis, we looked at “success trends” for software and IT companies in the S&P CapIQ database. We simplified “success” as reaching a liquidity event and compared companies over time. If the data suggested that more of the companies being funded today were exiting, it was more likely (though not causal) that investors were picking winners.
This time, when we turned to the data, our hypothetical explanation for rising prices was confirmed.
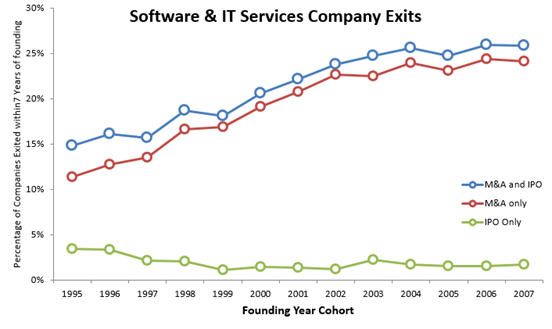
Source: S&P Capital IQ accessed June 2015, Sapphire Ventures Analysis
For software and IT companies founded between 1995 and 2007, there was a steady upward trend in the number of companies that made it to a liquidity event within seven years. From the data, about 10 percent more companies found their way to an exit today than they did through the dot-com bubble.
The observation is a strong sign that investors in technology have more downside protection today than they had in the past. How much downside protection investors receive is unclear.
It’s possible that the difference here is explained not by picking “winners” but by picking companies that aren’t “losers.” A further cut of the numbers revealed that the growth in exit activity came primarily from M&A.
This certainly incorporates today’s “acqui-hires” — a type of acquisition that doesn’t confer the same returns to investors as yesteryear’s multi-billion dollar deal.
That said, any downside protection is beneficial, and even if all the growth came from acqui-hires, this data point can explain away some of the rise in asset prices. What we have to assume is that no more than 100 percent of the growth in these exits came from these low-value acqui-hires.
The Reality Of “The Bubble”
After turning to the numbers, what we found was mixed — two lies and a truth, to paraphrase the old party game.
I’m still cautiously optimistic about the market. My mentor, Clay Christensen, loves to say that forecasting based on the data alone is akin to steering a ship by staring only at the wake.
It feels like the market is changing more rapidly than ever. In the last five years, technology adoption patterns could have changed so dramatically that the public data we looked at is largely irrelevant.
But even for an optimist trying to explore the firmness of the market, the analysis is enough to inject some healthy skepticism into current valuations and provide some interesting fodder for the arguments made by Bill Gurley, Fred Wilson, Mark Cuban and Jason Lemkin.