
Editor’s note: Matt Witheiler is a general partner at Flybridge Capital Partners. You can follow him on his blog.
If the past few quarters were not proof enough that the hardware community is increasingly using crowdfunding for early validation and consumers are willing to take risks on new products, the first quarter of 2015 should settle the debate.
A total of 128 hardware companies pre-sold nearly $70 million in products in Q1 – that’s something like 35 percent of the total dollars hardware projects had raised since Indiegogo and Kickstarter first launched over five years ago. A record quarter for hardware crowdfunding, indeed, but what’s the broader state of the hardware crowdfunding union?
Projects and Dollars
Of 128 companies that had campaigns that broke the $100,000 threshold used in this analysis, 65 percent were hosted on Kickstarter and 35 percent were on Indiegogo. The gap between the two platforms is quickly shrinking, and while Kickstarter captured the majority of the dollars thanks to a single blockbuster campaign, the median dollars raised on Indiegogo were actually higher. In other words, the long tail of Kickstarter is longer than that of Indiegogo but the fat tail isn’t as pronounced as it once was.
While $68.4 million was raised in the quarter, the unquestionable winner was Pebble. The Pebble Time product shattered all previous campaign records by selling $20 million worth of watches. For comparison, Fossil sells just double this amount in a normal Q1 across all their models and stores – not bad for a startup.
Stripping this campaign out brings the total dollars raised down by almost a third and makes me wonder what kind of wooing Kickstarter had to do to get Pebble to launch with them. My money is on drastically reduced fees since Pebble could have easily gone it alone.
Other projects that had great campaigns this quarter include Sondros and Zano. These two raised $4.7 million and $3.5 million respectively as of March 31.
From a category perspective, clearly wearables had a banner quarter but let’s see how others fared:
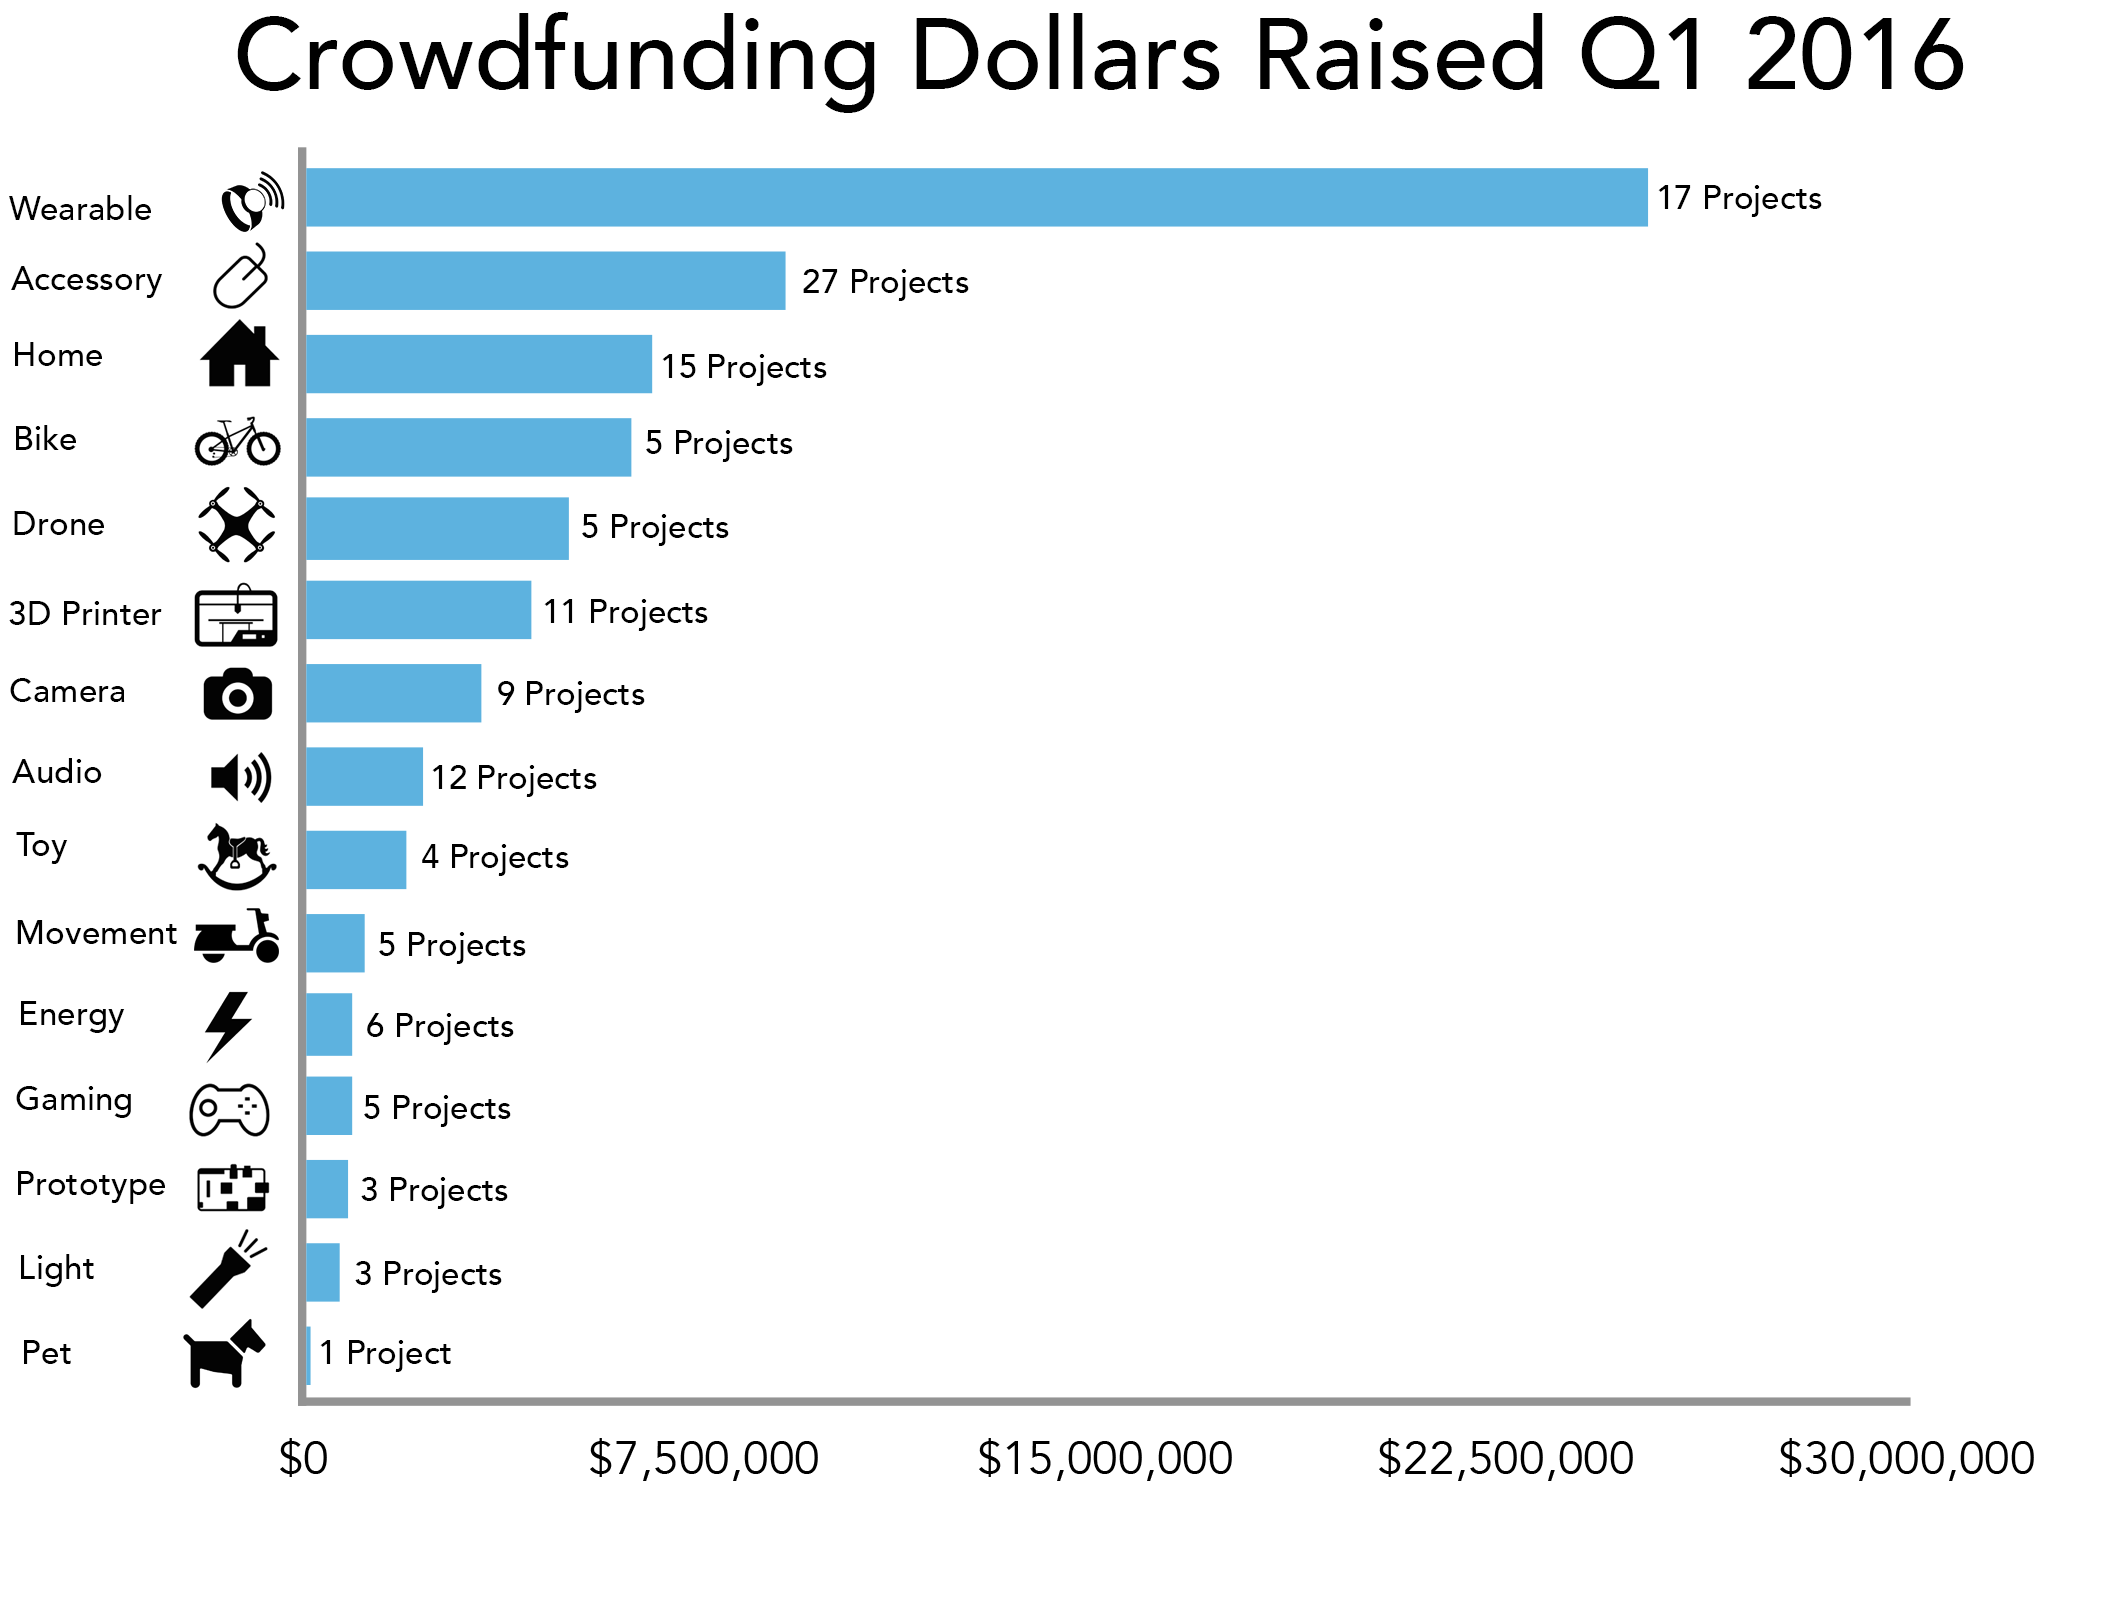 The accessory (devices that plug into computers, cellphones, tablets, etc.) and home (devices used for security, cooking, cleaning, etc.) categories both performed strong in Q1 with a total of 42 projects raising $15.6 million.
The bike category also did well – five projects raised a total of $6.1 million. 3D printers, the darling category of past analyses, had a pretty weak quarter with only 11 projects raising $4.3 million. It appears the category may be hitting consumer fatigue with so many seemingly similar products launching over the past few years. Short of a blockbuster product, it would be surprising to see large dollars in this category going forward.
Shipping Status
Perhaps the biggest complaint about crowdfunded hardware projects is the delays that have plagued consumers. As the data from December showed, only one in five venture-backed products delivered on time and it was not entirely uncommon for products to deliver three or more months late. So how did the first quarter shake out from a shipping perspective?
 As of March 31, nine previously delayed products that raised venture funding finally shipped and 27 others were still not shipping. The past due dates ran from a month all the way to over a year-and-a-half (we’re looking at you, Ube). In total, 11 million crowd dollars remain tied up in venture-backed hardware projects that have yet to deliver but have not yet died.
The coming months will be telling ones since the 128 projects that raised money from the crowd this past quarter will deliver, on average, in June/July of this year. If history repeats itself, we can expect many of these to be late. At least some companies are buying themselves time such as the UnaliWear Kanega and Neptune Suite, which both promise February 2016 deliveries.
Overlaying promised ship dates with dollars raised in the first quarter can give an interesting, albeit busy, view of where the quarter landed.
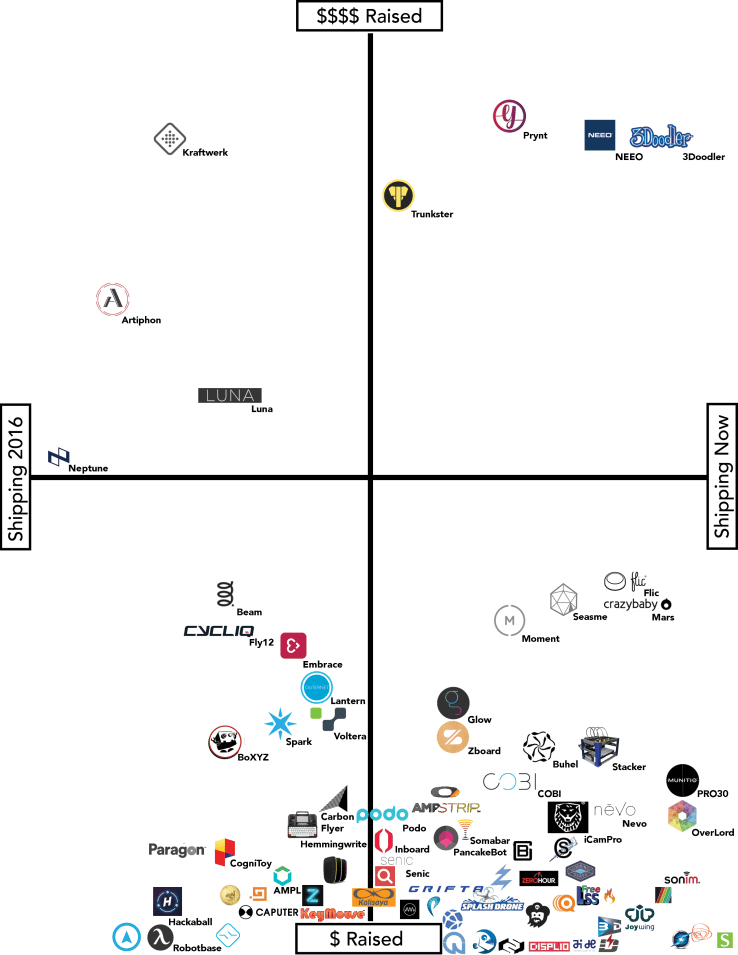
The graph is limited in that large outliers like Pebble Time, Sondros and Zano were too difficult to place and the 40 or so campaigns that raised less than $150,000 in the quarter were too clustered to fit. That said, the graph really demonstrates the haves and have nots of this world, with just a few projects collecting over $1 million. The fact that promised delivery date appears uncorrelated with dollars raised is also interesting since it indicates consumers are happy to wait when pre-ordering a product.
Big things are happening with hardware crowdfunding on Indiegogo and Kickstarter – the numbers from Q1 demonstrate that. What is more difficult to capture but increasingly becoming part of the picture are projects that use neither platform and instead self host.
These campaigns are generally not transparent and are therefore hard to track but a rough guess is that about one-sixth of hardware campaigns by dollars go this route. If that’s the case, the hardware ecosystem pre-sold about $85 million in the quarter. A killer quarter no matter how you measure it.
There’s little question that crowdfunding will continue to be an important tool for hardware startups going forward. But the bigger question is will consumers continue to buy. If Q1 is any indication, the answer is a resounding yes.
Access to the data used to generate this report is available on this Google Spreadsheet.