The calls for people to #deleteuber keep coming in after revelations that an Uber executive casually suggested opposition research on journalists; that Uber has used and abused its so-called “God View” to access and share information about individual customers; and that some in the Senate are now calling for answers around the controversies. We’ll have to see what kind of a long-term impact all this will have on the company. Up to now, Uber has been riding high.
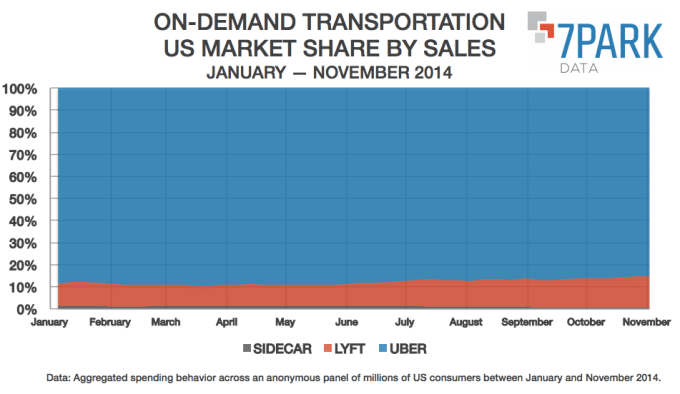
New statistics from app research firm 7Park indicate that the app is accounting for 85% of all transport app spend at in the U.S. at the moment. And figures from App Annie indicate that Uber is still the number-one transportation app in the key U.S. market in terms of downloads, and at 34 in overall app rankings.
Of course, all of this is a relative business — these numbers do not take into account how Uber is performing in other markets outside the U.S., nor how Uber sales and ride costs compare to those for transportation services that are not picked up via apps.
But at a time when apps and smartphones are becoming ever more ubiquitous and we are seeing massive shifts in how consumers procure and pay for all goods and services, and at a time when we are seeing a crescendo of negative opinion about Uber specifically, they are indicative of how the company is progressing overall.
7Park, which aggregates anonymised data from millions of consumers in the U.S. between January and November, says that Lyft is currently the firm number two, but with only about 15% of sales as of this month. Those proportions have changed only by a few percentage points so far this year, in favor of Lyft. Sidecar, the very distant number-three, is too small to make a dent against the other two:
Drilling down into the numbers, it looks like Lyft at the moment is the faster-growing company, with sales up 487% compared to a year ago, compared to Uber’s growth of 262%.
In one regard, that is not too much of a surprise: Lyft is smaller and therefore growth is more pronounced as it continues to pour more dollars into its marketing. But the smaller-equals-faster formula is not always the case: Sidecar has “only” increased its sales by 54.4% over last year.
Some of this is a product of funding: Lyft has to date raised $332.5 million from VCs, while Sidecar has raised about a tenth of that, $35 million. Uber, of course, has raised way more than the two of them put together — $1.5 billion — and is reportedly trying to raise more, possibly to distract and put yet more pressure on its rivals, but almost certainly to continue investing in this rapid global expansion.
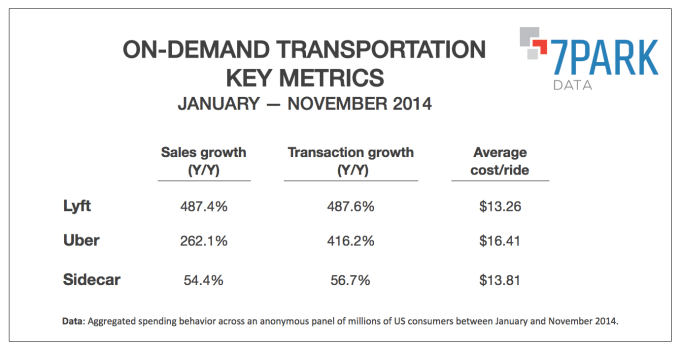
When it comes to transaction growth, Uber and Lyft are actually a lot closer in their growth, with both at over 400%. On the cost per ride, the moment, Lyft is proving to be the less expensive option — costing on average $3 less with an average cost per ride of $13.26.
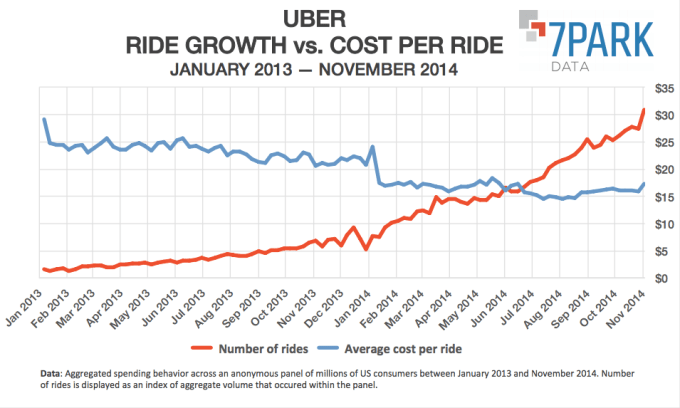
Why has Uber’s sales growth not kept up with its transaction growth? As 7Park’s numbers show below, it seems to do with the fact that the cost per Uber ride has been in a gradual decline, even if it is still the most expensive compared to Lyft and Sidecar.
Looking at Uber’s numbers more closely, it looks like there is a strong chance that Uber’s rates will continue to drop. As you can see in the table below, as the volume of rides has continued to grow for Uber, the cost has declined.
The $3 margin between Uber and Lyft indicates that in markets where both companies are active, Uber rides may come down in price even further, heightening the Uber paradox: the choice could become even trickier for those who are on the one hand frustrated and concerned by all the negative Uber stories, and on the other continue to be pulled in by the service the company offers (especially in markets where direct, app-based competitors have yet to launch).