Technology makes it easy to turn the minutiae of our daily lives into useful data sets, but sometimes it feels bleak seeing every experience or memory broken down into pie charts and bar graphs. mem:o is a unique visualization tool that takes life-logging beyond spreadsheets by transforming data into striking images influenced by Dutch graphic design. The iPad app is free for download and includes two boards, with the option of adding more boards via an in-app purchase.
Developers Caroline Oh and Young Sang Cho, the duo behind studio c+y, say the app’s look was inspired by the bold shapes and playful colors of graphic design influenced by Werkplaats Typografie (Typography Workshop), a masters program run by the ArtEZ Institute of the Arts in the Netherlands. mem:o uses a font called Brown that was created by Swiss designer Aurèle Sack to be especially legible. But mem:o isn’t targeted at design nerds only. The app stands apart because of its streamlined functionality and the easy-to-understand charts it creates.
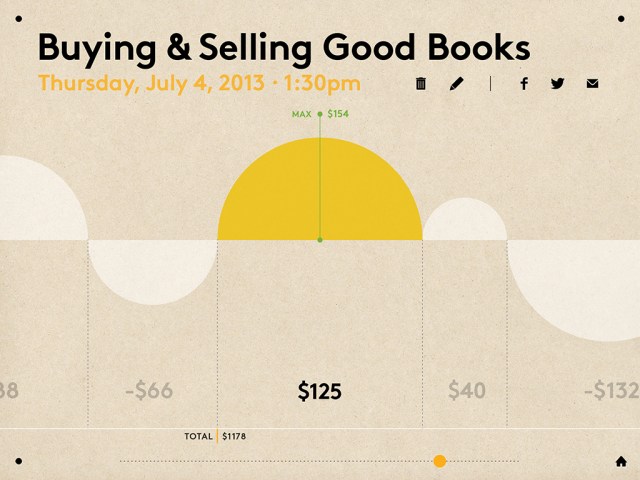
“With personal data, you are generally looking to pick up on habits and trends, rather than execute complex calculations. Our goal for mem:o was to allow the user to easily see these kinds of relationships without getting lost in extraneous complexity,” Oh and Cho told me in an email.
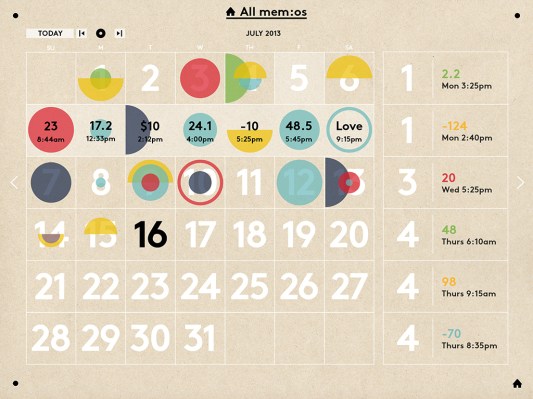
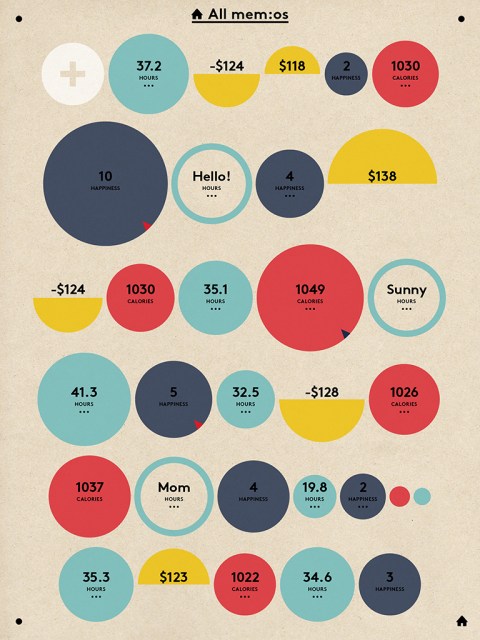
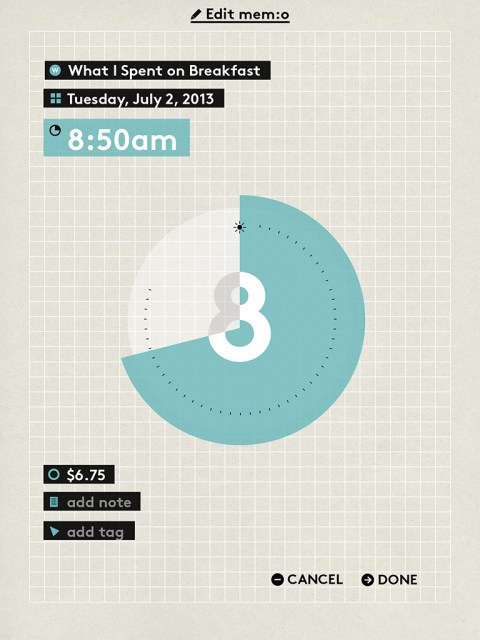
To create a chart, all you need to do is chose a color palette from seven options and start entering your data. Each chart gives you the option of adding a unit (dollars, hours, minutes, miles, yards or feet), the date and time for each entry, as well as tags and a brief text note. You can see your data sets in board or calendar views. I found the latter option especially helpful for tracking my daily calories, exercise and weight, and seeing at a glance how the three things are related, but mem:o’s developers hope its users will enjoy finding unexpected correlations between their personal data. The app’s home screen was designed to be “somewhat chaotic,” with unrelated boards juxtaposed.
“Before we had mem:o, this is how we often encountered our notes and numbers as we jotted in notebooks,” said the duo. “These kinds of ‘accidents’ should have a presence in the digital world as well.”
Before creating mem:o, Oh and Cho collaborated on the design and software development of several large-scale interactive museum exhibits. Based in New York City, multidisciplinary designer and educator Oh is the co-founder of TKOH, a studio that is currently developing a Web and tablet platform for recording oral histories. Young is a software developer, designer and animator, as well as a director of Seoul-based studio Byul & Associates.
After working together on projects that displayed static content, Oh and Cho said they wanted to create an open-ended tool that could be used in different ways and had an interface design that was different from iOS defaults. The two thought about developing a note or list-making app, but realized playing with quantitative values would give them more design possibilities. mem:o was created to break away from standard formats of visualizing data, such as the aforementioned pie charts and bar graphs, and their association with office cubicles and PowerPoint presentations.
Oh and Cho are planning several additions to the self-funded app, including an expanded color palette and export options such as PDF files, but say they will make sure none of these new features take away from mem:o’s simplicity. An upcoming iPhone app will offer complementary features instead of being a shrunken down version of the iPad app.