
In a new report released this morning, mobile analytics firm Flurry took a deep dive into the different types of people, or demographic segments, which skew more heavily toward iPhone or iPad. Some of the findings were somewhat obvious – that shoppers and business travelers skew toward iPhone, for example. But others were a little surprising – like the fact that the group that skews most toward iPad are pet owners. Who knew?
For startup founders and mobile app developers, a study like this is important in terms of understanding your customer base, and how they use their devices, especially if you’re targeting a group that fits into a couple of different personality types. Of course, today’s report is about teasing out the differences between iOS users, and the context in which they’re using an iPad or iPhone – it can’t tell you about the Android user base, or those on other platforms, like desktops, BlackBerry or Windows Phone. (Though Flurry says that’s still to come for Android, at least).
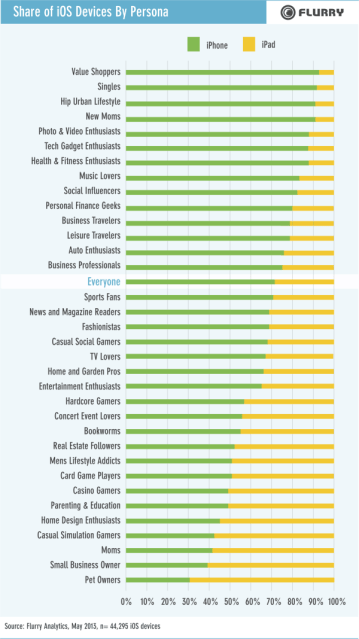
The chart below is interesting in terms of understanding which devices may be used by which personalities, and where that usage may be taking places.
The study was based on an analysis of a random sampling of 44,295 iOS users on Flurry’s network in May. The company currently measures activity on 397 million active iOS devices, which gives it a large enough footprint to draw its conclusions.
Though the chart shows many of these so-called “personas,” or personality types, it’s important to note that individual users may fit into one or more personas because they over-index on a variety of applications. In addition, their personas may not be the same on iPhone as they are on iPad. In other words, people are not just gamers or bookworms, they could be both.
The “Everyone” benchmark in the chart shows the general iOS population skews more to iPhone (72 percent share) than iPad (28 percent share).
Those who tend to be on the move, like the above-mentioned travelers and value shoppers, tend to skew toward iPhone, as do the single and “hip urban lifestylers” (by which Flurry means “hipsters”), also skew toward iPhone – in fact, the iPhone represents more than 90 percent of the iOS devices owned by those groups, says Flurry.
Meanwhile, it’s interesting also to see that the moms group’s iOS usage changes over time. New moms skew toward iPhone, then they later skew more toward iPad. Flurry theorizes that this is because newer moms don’t have as much free time for leisure activities like reading and gaming, which is probably true. (There may be a practical reason as well, as any mom could tell you: have you ever tried feeding the baby while using an iPad one-handed? Ha.)
Plus, as the children age, moms often tend to put educational apps and games on their iPads for their kids, according to another recent tablet usage study by Nielsen.
The groups that skew toward iPad include the pet owners, home design enthusiasts, and small business owners. Again, some of these findings seem like common sense, if you had been asked to guess, but it’s always good to have the hard data on hand to back up those conclusions.
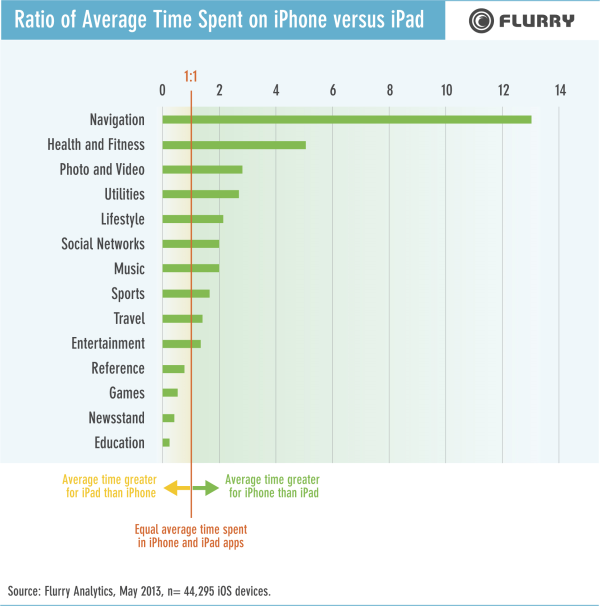
Flurry also looked into the time spent in apps on the different devices. Overall, iPad owners spent 42 percent more time in apps than iPhone owners during the month. iPhone owners spent more time using navigation, health and fitness apps, while iPad owners, on average, spent more time in educational apps, and those in Reference and Newsstand sections.
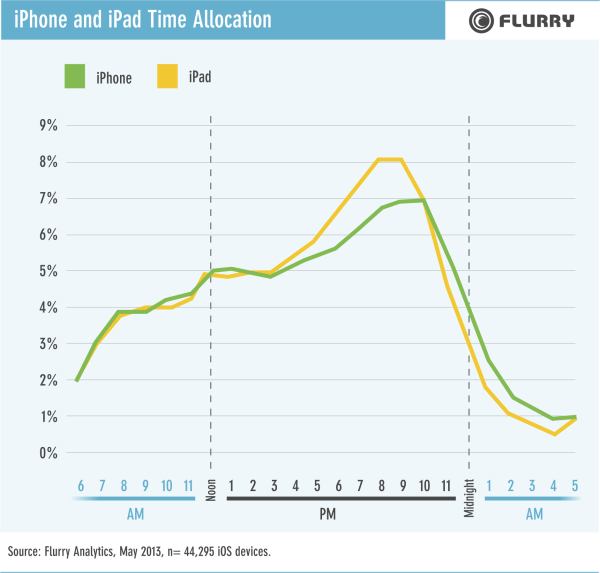
iPads were more heavily used than iPhones at night, around 6 to 11 pm, while insomniacs will pull out their iPhone more than their iPad around 2 to 4 am.