
For a while, it looked like Trulia, the online marketplace for homebuyers, sellers, renters and real estate professionals, was going to cede much of its ground to Zillow, Redfin and other newcomers. Lately, however, the company has been making a bit of a comeback, with a successful IPO, back-to-back product launches and acquisitions. The company also recently finalized a $150 million follow-on offering for acquisitions and mergers.
Today, the company launched yet another addition to its product: visualizations of current per-bedroom rental prices in cities across the U.S., as well as new maps for tracking the risk of earthquake and flood risks in a given neighborhood.
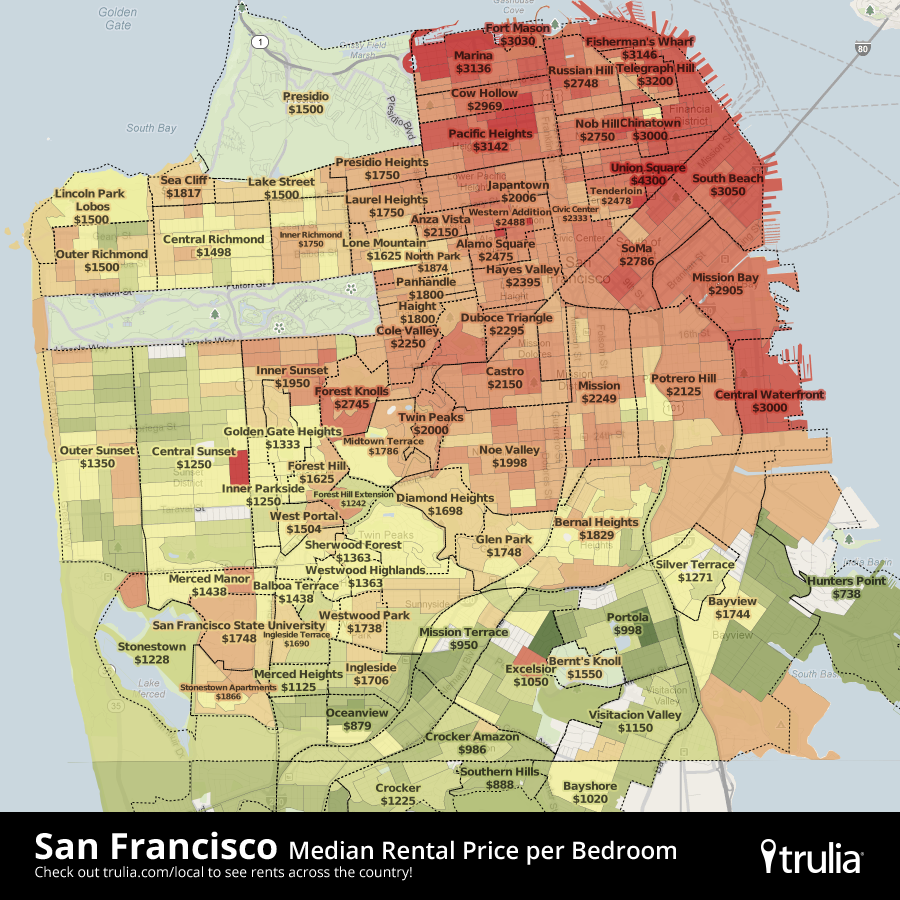
In red-hot markets like San Francisco (where the company is headquartered and the earthquake risk is pretty much a given), the rental map is obviously the most interesting.
In other markets, knowing earthquake and flood risks can also help prospective buyers make their purchasing decisions. “After considerable damage in recent years, many consumers likely feel as if the frequency and severity of natural disasters is increasing across the United States, but up until now the risk of these events has traditionally been hard for homebuyers, sellers, and renters to find,” Lee Clancy, Trulia’s VP of Consumer Products, noted in today’s announcement. “Now house hunters can use our maps to see flood zones and understand where earthquakes are more common in order to make informed decisions about where to move.”
Trulia uses USGS and California Geologic Survey data to show these seismic hazards and FEMA data to visualize flood risks. The service already offers visualizations for home values, crime, school rankings and commute times. These maps, as well as the newly announced visualizations, are available on the company’s website and through its mobile apps.
![SF_SeismicMap[3][1]](https://techcrunch.com/wp-content/uploads/2013/05/sf_seismicmap31.png)