Editor’s Note: The following is a guest post from Sameer Al-Sakran. Al-Sakran is a data scientist and machine learning specialist who was formerly the engineering manager at Imeem.
Hey kid, wanna get rich?
After watching “The Social Network” for the third time this weekend, are you feeling ready to create something truly world-changing and make a billion dollars? Have you just finished off an MBA and are looking for a job slightly more glamorous than traveling 364 days a year for a Big 3 consulting firm? Are you getting hit up for co-founder gigs in between gigs making web pages for dentists and want to know what white-hot area you should get into, if you did decide to live the dream?
We’ll you’re in luck. We’ve gone through CrunchBase (which is basically a National Treasure, or at least a treasure trove of data), and tallied up how well various company categories have done over the years.
IPOs
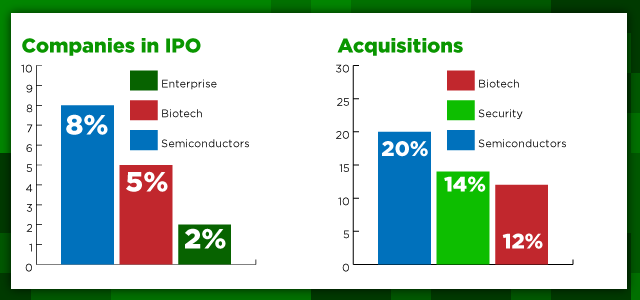
If you have your heart set on a public offering, get into chips. Semiconductors that is. A full 8% of these types of hardware companies in CrunchBase ended up in IPO.
But, if you don’t know a transistor from a Macbook charger, maybe try drugs? Biotech companies were second with a good 5% IPOing. If you’re set on a software company, the common dictum is to stick to the Enterprise side of the equation; 2% of Enterprise software companies we’ve been tracking have IPOed — as opposed to under 1% of general software companies and even fewer web companies.
Acquisition Happy?
Maybe Sarbox has you scared and you just want a big check and a shiny new business card at an acquisitive giant conglomerate.
Semiconductors (20%), Security (14%) and Biotech (12%) companies led the way there. Just be careful … for every massive Instagram acquisition, many others were soft landings or acquihires. It might be rough going from ruling your own (small kingdom) to filling out TPS reports.
Total funding:
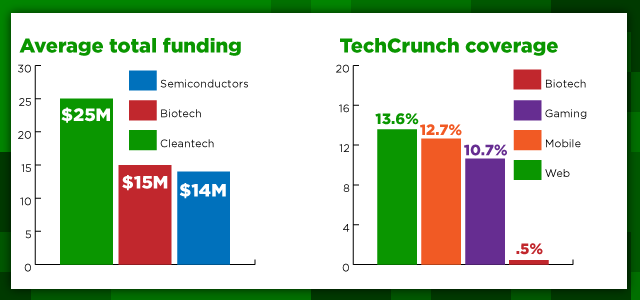
If you’re up on your self-improvement seminars and realize that the process is more important than the goal (or you just want to raise a bunch of money and have U2 play your launch party) then you can also raise funding. The average amounts of total financing raised by capital-intensive Cleantech, Biotech and Semiconductor companies were 25M, 15M and 14M respectively.
TechCrunch Coverage
Not into the whole material riches or success thing? Want to be famous but can’t hold a tune and have horrible hand-eye coordination? Well, if you want to make TechCrunch, you might want to start one of those web companies. Not shockingly, Web, Mobile and Gaming were the sectors most likely to be covered on TechCrunch with 14, 12 and 11% of CrunchBase companies getting at least one mention. At the bottom of the list was Biotech, with less than half a percent of Biotech startups getting any coverage.
The Losers
Which categories should you avoid? Consulting has only had 3% of companies started that end up acquired and less than 0.5% IPOs. And well, for all the current hullabaloo, Education has had 0 IPOs and a 1% acquisition rate. And in last place, Legal companies have also had 0 IPOs and a sub 1% acquisition rate, though the recent filing of LegalZoom should change that dire statistic.
* Caveats: All numbers are based on CrunchBase and are backwards looking. Also, there is a fair bit of survivor bias in the results, in that successful companies are more likely to be in the database.
Want the full gory details in Table-format? Well here you go:
| Category | Started | Funded | Total Raised | TC Posts | Acquisitions | IPOs | % on TC | % IPOd | % Acquired | % Funded | Avg Funding |
|---|---|---|---|---|---|---|---|---|---|---|---|
| Advertising | 3972 | 631 | $8.2B | 996 | 221 | 15 | 6.39 | 0.38 | 5.56 | 15.89 | $2M |
| Biotech | 2787 | 1770 | $42.4B | 43 | 332 | 143 | 0.43 | 5.13 | 11.91 | 63.51 | $15.2M |
| Cleantech | 1302 | 719 | $32.8B | 192 | 72 | 39 | 5.53 | 3 | 5.53 | 55.22 | $25.2M |
| Consulting | 3330 | 176 | $2.0B | 444 | 107 | 15 | 1.26 | 0.45 | 3.21 | 5.29 | $600k |
| Ecommerce | 5383 | 868 | $10.1B | 1587 | 188 | 16 | 5.67 | 0.3 | 3.49 | 16.12 | $1.9M |
| Education | 522 | 60 | $483M | 90 | 4 | 1 | 3.64 | 0.19 | 0.77 | 11.49 | $925k |
| Enterprise | 2389 | 652 | $9.9B | 993 | 257 | 41 | 9.29 | 1.72 | 10.76 | 27.29 | $4.1M |
| Games video | 3992 | 910 | $15.7B | 3625 | 285 | 30 | 10.65 | 0.75 | 7.14 | 22.8 | $3.9M |
| Hardware | 1726 | 613 | $11.9B | 3274 | 139 | 81 | 6.03 | 4.69 | 8.05 | 35.52 | $6.9M |
| Legal | 306 | 23 | $104M | 16 | 2 | 0 | 1.31 | 0 | 0.65 | 7.52 | $340k |
| Mobile | 4101 | 1099 | $20.1B | 4263 | 275 | 34 | 12.66 | 0.83 | 6.71 | 26.8 | $4.9M |
| Network hosting | 1782 | 340 | $7.9B | 1375 | 154 | 22 | 7.46 | 1.23 | 8.64 | 19.08 | $4.4M |
| Other | 33068 | 2022 | $24.1B | 2501 | 2325 | 101 | 2.46 | 0.31 | 7.03 | 6.11 | $730k |
| Public relations | 2531 | 468 | $6.9B | 765 | 171 | 32 | 4.74 | 1.26 | 6.76 | 18.49 | $2.7M |
| Search | 1437 | 226 | $2.7B | 4625 | 57 | 4 | 9.81 | 0.28 | 3.97 | 15.73 | $1.8M |
| Security | 710 | 218 | $4.1B | 135 | 96 | 12 | 6.76 | 1.69 | 13.52 | 30.7 | $5.8M |
| Semiconductor | 620 | 381 | $9.2B | 27 | 119 | 51 | 2.74 | 8.23 | 19.19 | 61.45 | $14.9M |
| Software | 12405 | 3039 | $33.1B | 3733 | 1101 | 110 | 4.89 | 0.89 | 8.88 | 24.5 | $2.6M |
| Web | 12830 | 2401 | $29.2B | 14356 | 827 | 57 | 13.59 | 0.44 | 6.45 | 18.71 | $2.3M |


Photo: Erik Dreyer/Getty Images
