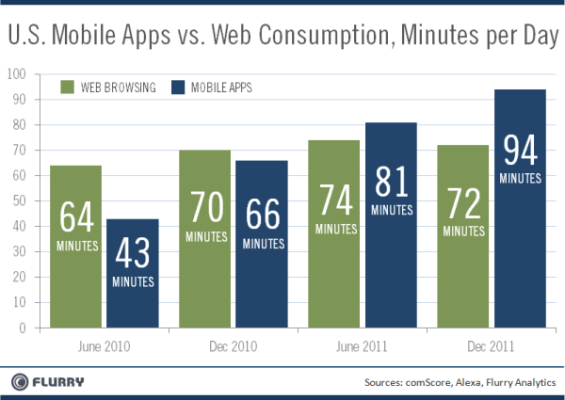
Mobile analytics firm Flurry has updated its report from last summer which compared mobile apps to web consumption and found that apps came out on top. In June, Flurry discovered that users were spending 81 minutes per day in mobile apps versus 74 minutes on the web. As of December, the usage of mobile apps has skyrocketed to 94 minutes per day, while web consumption dropped to 72 minutes.
The interesting thing about this data is that the most recent growth in mobile apps usage hasn’t really been at the expense of browsing the traditional web. People have just been using mobile apps more. We should note, however, that Flurry pulls its web data from comScore and Alexa, which aren’t always the best sources and use differing methodologies to determine browsing habits. In addition, users of mobile apps also browse the web, so it’s not so much a question of apps “versus” the web, as it is a look into our data consumption in general (despite Flurry’s positioning it as a battle that’s to be won or lost).
But the bottom line is: apps are hot.
Flurry notes that roughly 40 billion applications have been downloaded from the iTunes App Store and Android Market since their debuts. And we’re only at the beginning of the mobile app era. As Flurry’s end-of-year research found, the addressable market for mobile app developers is still in the millions.
The new report attributes the small decrease in traditional web consumption to a decline in Facebook use. In June, people spent over 33 minutes per day on the Facebook website, and now that number is below 24 minutes. Meanwhile, time spent on the web without Facebook grew by 2% between June 2011 and December 2011.
That doesn’t necessarily mean trouble for Facebook – it just means good news for Facebook’s mobile apps. As an unrelated report recently found, the number of monthly active users of Facebook’s mobile apps recently passed the 300 million mark (or 40% of Facebook’s official 800 million+ users). Flurry confirms the same trend, saying “we believe that Facebook users, and users of other traditional style websites, are increasingly accessing services through mobile applications than from desktops.”
In this case, it may be a choice of apps “versus” the web.
As a part of today’s research report, Flurry also provided insight into which mobile app categories were the most popular. Not surprisingly, games led with nearly half (49%) of U.S. users’ time spent. Social networking (30%), Entertainment (7%) and News (6%) followed, with the “Other” category (accounting for everything else) at 8%.

Combined, social networking and gaming is 79%, which offers an interesting perspective on what mobile app users really do on their phones. We play.