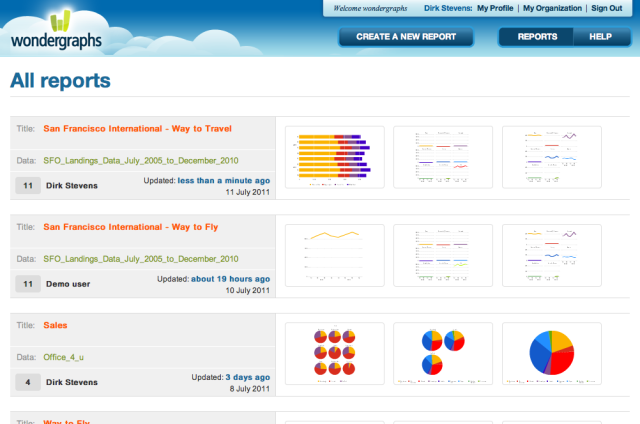
Always a pleasure to find that there are innovative startups building really cool stuff in my own backyard. Meet Wondergraphs, a bootstrapped company that is building Web-based software that lets people do beautiful things with data. Suddenly, analyzing corporate – or publicly available – data and creating graphs for reporting purposes becomes much more exciting than what it sounds like.
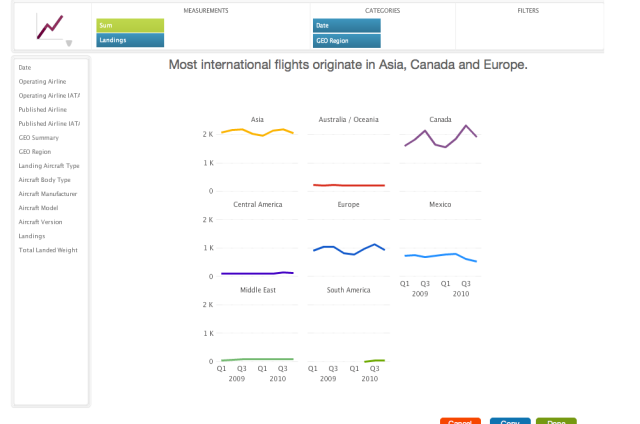
The Wondergraphs tool lets you easily and rapidly upload data you want to base your reports on and churn out great-looking charts in a flash (video demo). The tool lets you aggregate, group and filter any data you throw at it, using drag-and-drop, and enables you to create clear charts on the fly.
You can simply import data from Microsoft Excel through copy/paste, via CSV files or straight from online services like Google Spreadsheets and Factual. To fit the needs of developers, Wondergraphs also links to database systems like MySQL, Oracle, Microsoft SQLServer and MS Access, and offers an API upon request to boot.
Any reports generated through Wondergraphs can be viewed online, or can easily be exported to Microsoft PowerPoint. The team is also building an impressive iPad app to add to the output line-up.
One caveat: to create reports and analyze data, one must have Flash player 10 installed, although Flash is not required for viewing reports.
Pricing varies from free to $25 per month or $100 per month for customers with lots of data to process (and they do have some current clients in that category)
Wondergraphs has offices in Leuven, Belgium and Sunnyvale, California.
The company has been developing its software for a few years now, and hasn’t raised a dime in outside funding yet. Wondergraphs co-founder and CEO Dirk Stevens tells me they’re currently looking for “the right type of early-stage investor” to step in and spur further growth.
I have a feeling investors – particularly the few seed stage investors we have here in Belgium – will soon be kicking themselves for not finding out about this particular startup before this post.