

Editor’s note: The following analysis is written by Robert J. Moore, the CEO and co-founder of RJMetrics, an on-demand database analytics and business intelligence startup. Robert blogs at The Metric System and can be followed on Twitter at @RJMetrics.
Since launching just six months ago, Instagram has quickly become one of the web’s top photo sharing services. The company recently passed the two million user mark and announced the launch of their API.
We sampled data from that API and loaded it into an RJMetrics Dashboard for analysis. This yielded detailed new insights into Instagram’s growth and user adoption.
Please note that these are estimates extracted from a sample set, so there may be a small margin of error (more details on our methods can be found at the end of the article). I provide a full breakdown below, but here are some highlights:
- Instagram is currently adding 130,000 registered users per week
- Instagram’s 2.2 million users upload 3.6 million new photos per week (or 6 photos per second)
- 37.5 percent of registered users have never uploaded a photo
- 5 percent of users have uploaded over 50 photos
- 65 percent follow nobody, and only 12 percent of users follow more than 10 people
- For users who upload at least one photo, there is a 45 percent chance they will upload a photo the following week
- Those same users have a 25 percent chance they will upload a photo 12 weeks later, representing a significantly stronger retention rate than Twitter.
Users and Uploads
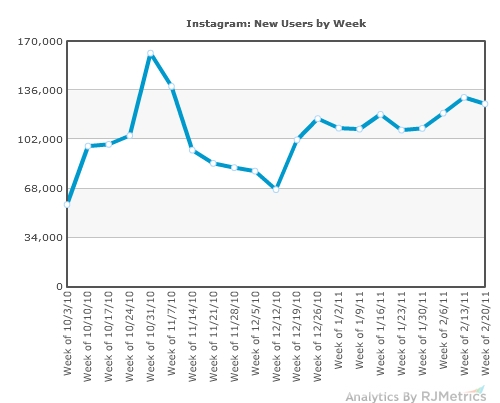
The chart above shows weekly new user additions since Instagram’s launch. The company is registering approximately 130,000 new users per week, and that number hasn’t fluctuated much since the new year.
When we view this chart on a cumulative basis, we can see overall user growth curve looks more linear than exponential (although its slope is quite impressive).
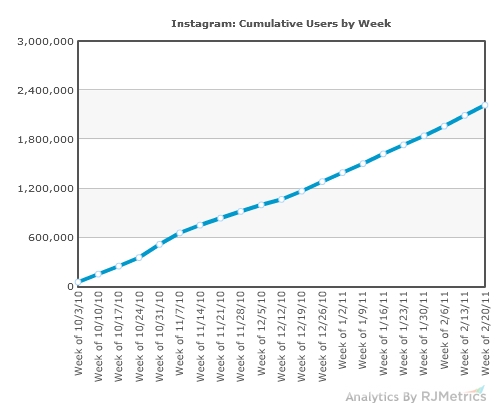
If it maintains its current pace, Instagram will continue to add a million new registered users every two months. Things get more interesting when you look at what these users are doing once they join.
Engagement
Unlike with registered users, the number of new photos uploaded on a weekly basis is clearly climbing, with 2.6 million new images uploaded in the most recent week.
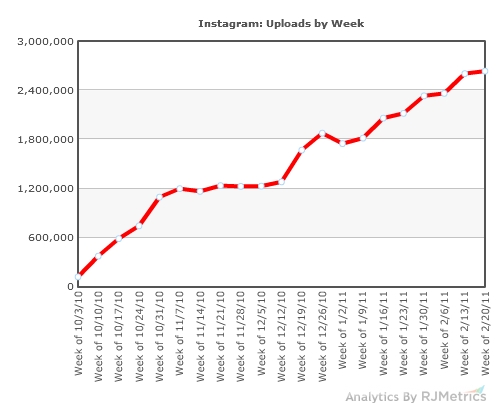
This is a strong indicator that users continue to use the service long after joining. As thousands of new users join each day, the millions that have joined in the past continue to use the service, creating an increasing flow of photos into the system.
When we view this chart on a cumulative basis we can see this exponential effect in action:
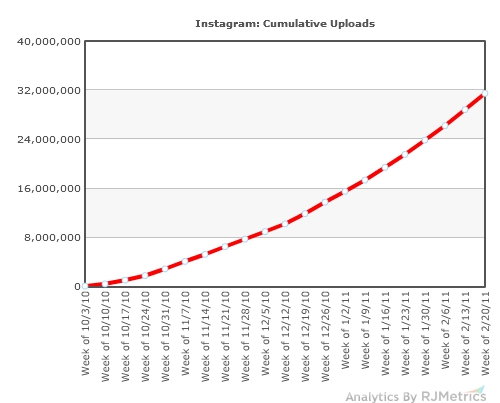
It doesn’t get much nicer than that. Despite this impressive trend, however, not all of Instagram’s 2.2 Million registered users are actively using the service.
Below, we show a distribution of users based on how many photos they have uploaded.
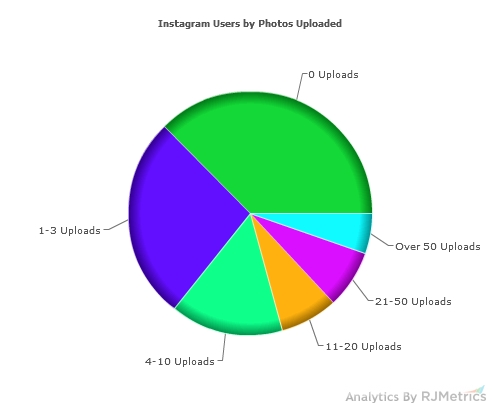
As you can see above, 37% of Instagram’s users have never uploaded a single photo and 65% have uploaded fewer than three photos.
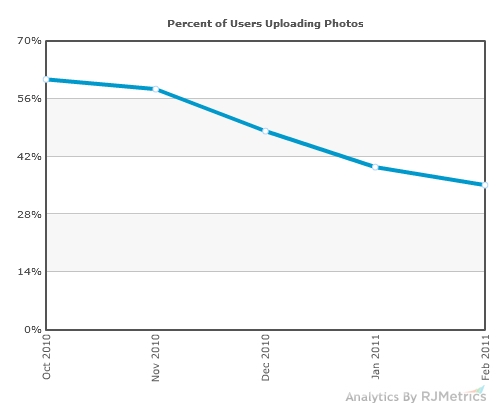
Our sample population indicated that about 35% of Instagram’s registered users uploaded a photo last month. This is down from previous months, which is typical in the early months of a new product’s life as the growth/churn ratio stabilizes. This number is clearly still in decline, and where it ends up will be a critical metric for Instagram. Based on its current base of 2.2 million users, this trend implies that around 800,000 Instagram users uploaded a photo last month.
This glut of inactive users is common in free online services, as we saw in our studies of Twitter Data and Foursquare Data last year. This isn’t necessarily a lack of total engagement, as users can use the app to simply follow their friends’ photo streams.
The distribution of followers (how many users a given user is following) is shown below.
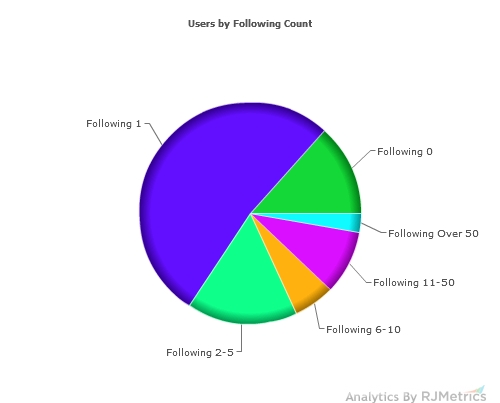
Interestingly, over half of Instagram’s users are following exactly one other user, with another 13% not following anyone. We checked into that, and it looks like the vast majority of users who follow only one other user are following the “Instagram Team” account, which was likely automatically added to their list at signup.
This means that 65% of users effectively follow no one.
Only 12% of users are following more than 10 people. Note that Instagram takes you through a process to find friends and other people to follow upon any new installation, explaining why more users are following someone than have uploaded a photo.
Repeat Upload Rate
We know that only 63% of users ever upload their first photo. We were curious about what happens next, so we used the distribution of photo uploads to approximate a “Probability of Incremental Upload” based on how many photos have been uploaded so far.
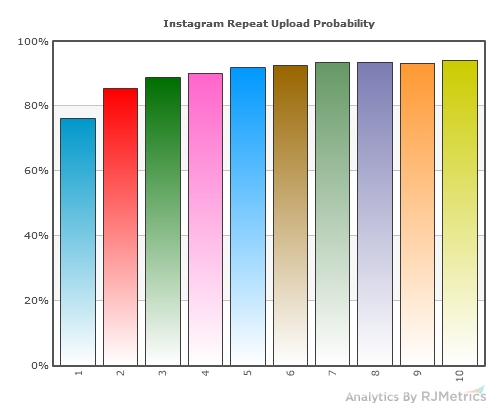
As you can see, every time a user uploads photo they become increasingly likely to upload another. 76% of those users who upload their first photo go on to upload a second, 85% of those users go on to upload a third, and so on.
Time Between Uploads
The average time between any two uploads made by a single user is 43 hours (obviously users who have uploaded one or fewer photos are excluded from this number). If we map out the average “Time Since Previous Upload” by upload number, we see another impressive engagement trend.
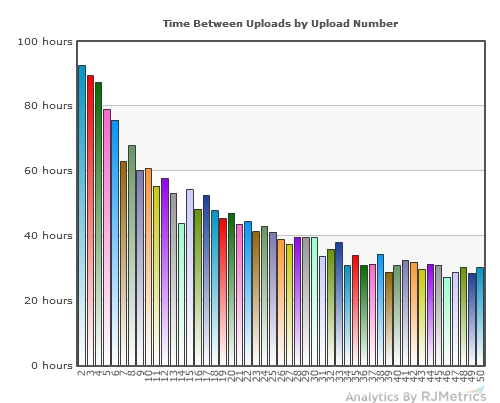
With each new photo uploaded by a user, the expected time until they upload their next photo decreases.
(Note that Instagram’s short history could make this chart a bit of a self-fulfilling prophecy. Since most users are less than a few months old, users who upload more frequently are obviously the only ones who have been capable of racking up those big upload counts.)
Cohort Analysis
Cohort Analysis is a powerful tool that we use to track user engagement and loyalty over time.
Each “cohort” is a group of customers who joined at a similar time, and we use cohort analysis to compare how different cohorts behave over the same relative periods in their lifecycles. User cohorts are typically grouped by month, but since Instagram has such a short history we used the Weekly Cohort feature in RJMetrics instead.
In the chart below, each line is a cohort of users who uploaded their first photos in a distinct week of Instagram’s history. The chart shows the percent of users in that cohort who came back to upload another photo in each subsequent week of their lifecycle. Note that, by definition, this excludes users who never uploaded a photo.
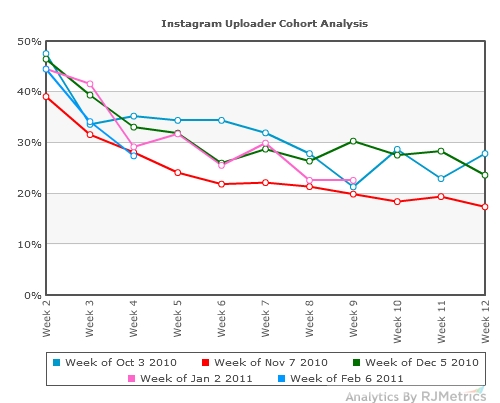
The decay we see here is typical in a cohort analysis. As each week goes by, a smaller percentage of the cohort’s users come back to upload again. Eventually, the lines stabilize, indicating the percentage of users in that cohort that have become “hooked” and are likely to stick around for quite some time.
These cohorts all appear to behave similarly. Typically, 45% of users are still uploading photos in Week 2, but that number drops down to around 25% by Week 12.
This may sound like a low number, but in the universe of free applications it’s actually quite impressive.
By way of context, Twitter’s weekly cohort numbers were notably lower at a similar point in their history. Instagram’s challenge will be retaining that core group of users and trying to push these cohort lines upward by luring their existing users back as time goes on.
Another interesting cohort perspective is to view the cumulative average number of photos uploaded per cohort member over time. This shows how each cohort contributes to the universe of photos during its lifecycle.
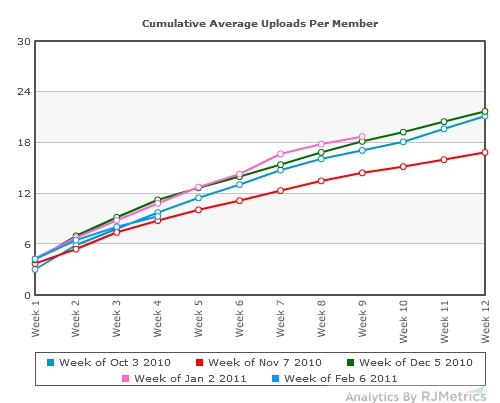
You can see a slight decay in the slope of these cohort lines, but they are pretty close to linear. In other words, despite a decreasing number of users uploading photos (as shown in the previous chart), the total number of photos uploaded by the cohort remains strong as time passes.
This suggests that users who continue to upload are uploading photos at a faster rate as time goes on. This is supported by the “Repeat Upload Rate” and “Time Between Uploads” charts discussed above.
Finally, it’s noteworthy that the “Week of November 7th” cohort is the poorest performer in both of these cohort analyses. If you look back at the user growth charts, you’ll see that this cohort was created during Instagram’s peak user growth period (its initial press wave upon launching).
This is evidence that users acquired during such press flashes are, on average, more likely to churn than new users who came in through other channels. We’ve seen this trend in countless other businesses.
How We Did It
Four things allowed us to conduct this analysis: Instagram’s new API, their use of incrementing ID numbers to represent users and photos, the central limit theorem, and the tools in the RJMetrics hosted business intelligence dashboard.
The central limit theorem tells us, among other things, that a large enough random subset of a large data set will behave like its parent set with a high degree of statistical confidence. Since the API allows us to retrieve content by ID number, we conducted a random sample of the data and extrapolated its properties to draw our insights. Our sample consisted of 9,200 users and their 116,000 photos.
Since user registration dates were not directly available via the API, we used the “first upload date” of a user (and its users with surrounding IDs) to approximate the join date of any given user.
This works on the assumption that at least some percentage of users will upload a photo within a very short time of joining. These earliest “first upload” dates within small ID ranges were applied to deduce approximate join dates, which we estimate to be accurate within a day at most.
We also explored the data to ensure that we weren’t overestimating due to “dead IDs” from deleted accounts and photos (which turned out to be a negligible percentage). Finally, we made sure to properly account for users and photos marked “private” that were not accessible via the API (although info from those accounts is not influencing account-specific insights such as cohort analysis).