
 comScore has released its July video metrix stats today, with the number of U.S. users watching online video content rising slightly to 178 million viewers compared to 177 million total viewers in June. In July, each viewer watched an an average of 14.7 hours of online video. And 84.9 percent of the total U.S. Internet audience viewed online video.
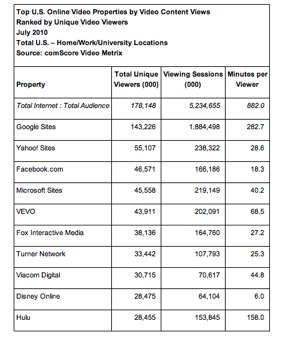
Unsurprisingly, Google Sites, whose viewership is driven primarily by video viewing at YouTube ranked as the top online video content property with 143.2 million unique viewers (compared to 144.5 million in June, followed by Yahoo Sites with 55.1 million viewers (compared to 44.9 million viewers in June). But the real news in the release is in Facebook’s growth as a video destination. Facebook.com jumped one position to capture the third spot with 46.6 million viewers, compared to 43 million viewers in June.
Google Sites had the highest number of overall viewing sessions with 1.9 billion and average time spent per viewer at 283 minutes, or 4.7 hours. Hulu also had high viewer engagement with an average of 158 minutes (or 2.6 hours) per viewer.
comScore also reported video ad metrics, a feature the company launched last month. Americans viewed nearly 3.6 billion video ads in July, with Hulu generating the highest number of video ad impressions at 783 million. Tremor Media Video Network ranked second overall (and highest among video ad networks) with 452 million ad views, followed by BrightRoll Video Network (248 million) and Microsoft Sites (232 million).
Google sites came in behind Microsoft with 219 million impressions but it’s important to note that this metric does not include banner ads, and other types of advertising used on YouTube. Video ads reached 27 percent of the total U.S. population an average of 44.5 times during the month.
The top video ad networks in terms of their potential reach of the total U.S. population were: ScanScout Network at 40.5 percent, BrightRoll Video Network at 39.4 percent, and Break Media Network at 38.7 percent. Video ads accounted for 9.8 percent of all videos viewed.
It also appears that comScore has changed the way it measure Hulu. For the past two months of reporting, Hulu has been last in terms of total viewership, which is odd considering the site rivaled Google for total viewers in the past. We’ve reached out to comScore for comment on this.
UPDATE: comScore says that the launch of Video Metrix 2.0 last month had an impact on Hulu. It looks like comScore is now separating ad views from content views, with the majority of views on Hulu as ads. Here’s part of the company’s response:
It’s also important to note that the majority of the decline in UVs for Hulu is actually attributable to seasonal viewing patterns, which are typically much lower in the Summer when fresh episodes are not on the airwaves. So in sum, the change vs. May data is a reflection of both the normal seasonal dip during the summer and our recalibration of the unique viewer metric.