
Editor’s note: The following analysis is written by Robert J. Moore, the CEO and co-founder of RJMetrics, an on-demand database analytics and business intelligence startup. Robert blogs at The Metric System and can be followed on Twitter at @RJMetrics.
Location-based social networks Foursquare and Gowalla are accumulating users (and headlines) with impressive momentum. While both companies have been vocal about reaching major milestones, we wanted to take a closer look at the data behind these accomplishments. Based on our estimates, Foursquare is not only bigger in terms of both users and venues, but it also is growing at a faster clip than Gowalla.
For the past four weeks, we’ve been monitoring the Foursquare and Gowalla APIs to track growth rates, as well as to sample users and venues. This data was loaded into an RJMetrics Dashboard, which provided the results found here with just a few clicks. We will keep these estimates up-to-date with fresh data and you can view them any time at our Startup Data page.
Here are a few highlights from our findings:
- As of today, Foursquare has just over 1.9 Million users. Gowalla has around 340,000.
- At its current pace, Foursquare will surpass 2 Million users within a week.
- Foursquare is adding almost 10x as many new users per day as Gowalla and, despite a significantly larger base, has a daily percentage growth rate that is 75% higher than Gowalla’s.
- Currently, Foursquare has about 5.6 Million venues and Gowalla has 1.4 Million venues.
- 1 in 3 venues on Foursquare have been checked into only once or never. That number is 1 in 4 on Gowalla.
- The most popular venue name is “Home,” followed by national fast food chains like “McDonald’s” and “Burger King”
- On Foursquare, men outnumber women almost 2-to-1. Exact gender breakouts are not available for Gowalla, but the most popular first names suggest a similar distribution.
User Growth
As of today, Foursquare has just over 1.9 Million users. Gowalla has around 340,000.
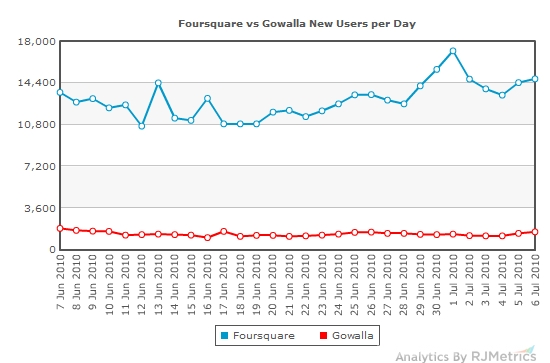
Over the past 30 days, Foursquare averaged 12,900 new users per day, while Gowall averaged 1,370. Recent new user acquisition by day for each service is shown in the chart below.
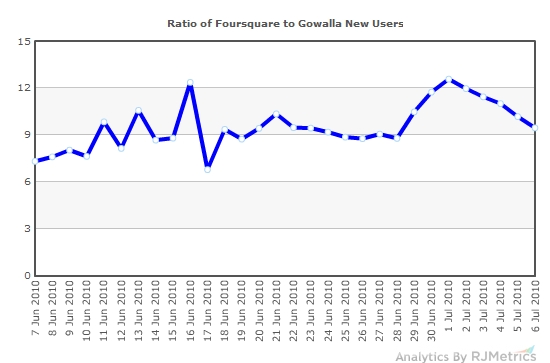
Foursquare is clearly acquiring users at a much higher rate than Gowalla, and this ratio of new Foursquare users to new Gowalla users is shown below. It averages almost 10-to-1.
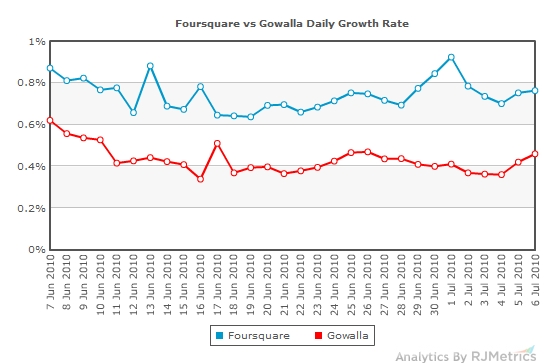
The numbers become even more interesting when you consider each company’s daily growth rate. This is the number of new users in a given day divided by the total user population from the previous day.
Since Foursquare is growing off of a much larger base, you might expect their percentage growth to be smaller than Gowalla’s. However, as shown below, their daily growth rate averages about 75% higher than Gowalla’s.
Venue Growth
Similar trends appear when we look at daily venue growth. Currently, Foursquare has about 5.6 Million venues (or about 3 per user) and Gowalla has 1.4 Million venues (or around 4 per user). The rate at which new venues are being added is shown below:
User Characteristics
Foursquare and Gowalla share different information about their users via their respective public APIs, revealing different types of statistics about each population.
On Foursquare:
- 64% of users are male, 33% are female, and 3% did not specify a gender
- 55% of users have uploaded a photo
- 28% of users have linked their Foursquare account to their Facebook account
On Gowalla:
- 38% of users have linked their Gowalla account to their Facebook account and 53% have linked to their Twitter account
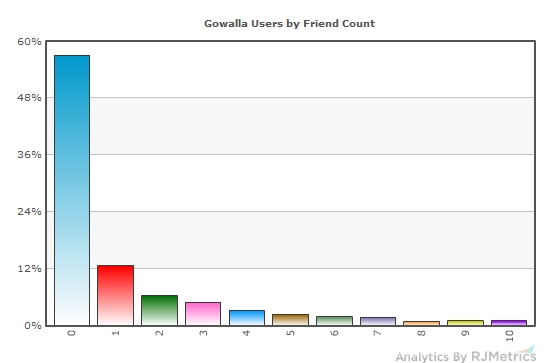
- 57% of users have zero friends and another 13% have only one friend
Interestingly, across both services, the five most popular first names are identical:
- Chris
- Michael
- David
- John
- Jason
Venue Characteristics
As with users, the available data differs between the two services.
On Foursquare:
- 18% of venues have at least one “tip” associated with them
- 3% of venues offer “specials”
- 32% of venues have been checked into only once or never
- The two most used venue categories are “Home” and “Corporate/Office”
On Gowalla:
- 25% of venues have been checked into only once or never
- 0.5% of venues have a Twitter username associated with them
Across both services, the most popular venue names are:
- Home
- Subway
- Starbucks
- McDonald’s’
- Burger King
- Walgreens
How We Did It
In most cases, this level of detail wouldn’t be accessible from the outside looking in. However, Foursquare and Gowalla have a few common characteristics that made it possible:
- Both companies use auto-incrementing ID numbers (1,2,3,4…) for both users and venues.
- Both companies have an API that allows us to access basic user and venue information by ID number.
- The central limit theorem tells us, among other things, that a large enough random subset of a large data set will behave like its parent set with a high degree of statistical confidence.
Our scripts tracked the maximum registered user and venue IDs each hour, along with randomly sampling data points throughout the population. This gave us a “density factor” so that we could adjust the absolute numbers to reflect deactivated accounts, deleted venues, and other skipped IDs.
In the end, our sample size consisted of about 82,000 data points from Foursquare and 36,000 data points from Gowalla. As with all such analyses, the results in this report are only estimates and could be skewed by flaws in our sampling methods or unconsidered outside factors.
Conclusion
Both services are showing impressive growth and are accumulating moutains of valuable, fascinating data. However, Foursquare is clearly the dominant player and their lead is increasing every day.
Be sure to keep an eye on our Startup Data page to track how these numbers progress over time. With Foursquare approaching the 2 Million member mark, it appears that this may only be the beginning.