
It’s still early days, but app store analytics company Distimo is already diving into the App Store for iPad, gathering some data and analyzing the results. More specifically, the startup has compared some preliminary data for iPad-only applications across multiple categories in the App Store with its findings on iPhone apps.
Distimo tracked 2,385 unique iPad applications in the marketplace as of 6 April, which is significantly less than the 3,000+ apps Mobclix accounted for on April 4. Perhaps Mobclix counted the applications in the App Store that were available for both iPhone and iPad, while Distimo only looked at iPad-exclusive apps, which would explain the difference (we’re awaiting a response from Mobclix to learn more about their counting methodology).
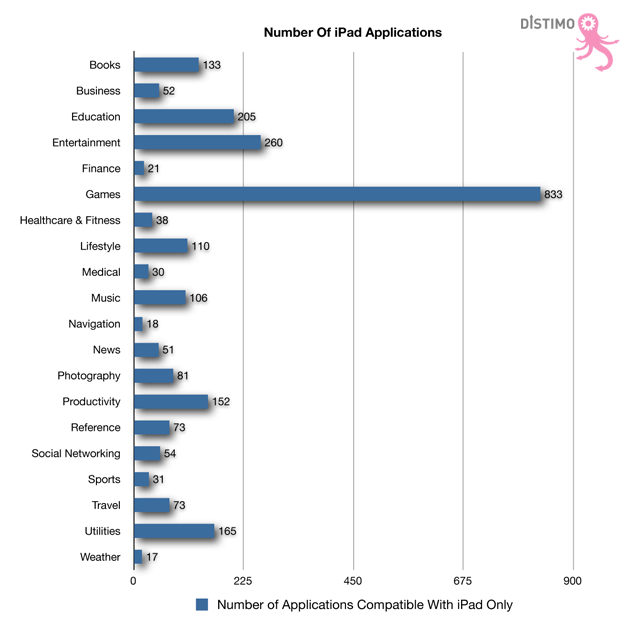
Out of those 2.385 iPad-specific apps, Distimo found that the ‘Games’ category is by far the largest with 833 titles (35%), followed by ‘Entertainment’ with 260 apps (11%) and ‘Education’ with 205 titles (8.6%), respectively. The – relatively – smaller categories include ‘Weather’ (17 apps), ‘Navigation’ (18 apps) and, perhaps surprisingly, ‘Finance’ (with 21 apps).
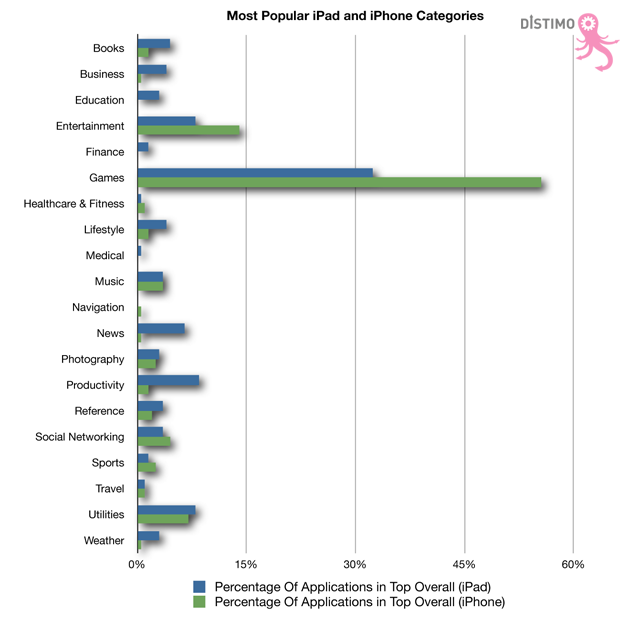
When comparing categories across devices, ‘Games’ and ‘Entertainment’ applications appear to be even more popular on the iPhone than on the iPad: 70% of the most popular apps on the iPhone are published in either of those two categories, compared to 40% on the iPad. We should note that there are more than 150,000 apps for the iPhone today, so take any comparisons to the less than 2,400 iPad apps with a grain of salt.
That said, it’s hardly surprising that games and entertainment apps are clearly the most popular categories for both the iPhone and the iPad – both devices come with a high-quality touchscreen, boast powerful processors and are excellent for content consumption as well as playing anything from simple games fit for kids to complicated ones that require advanced gaming skills. But if the iPad, and by extension other potent tablet computers, will ever replace laptops (like some contend) is a whole different story imho.
Also, note the difference in percentages for the ‘Business’, ‘Productivity’ and ‘News’ categories.
Now let’s take a look at pricing.
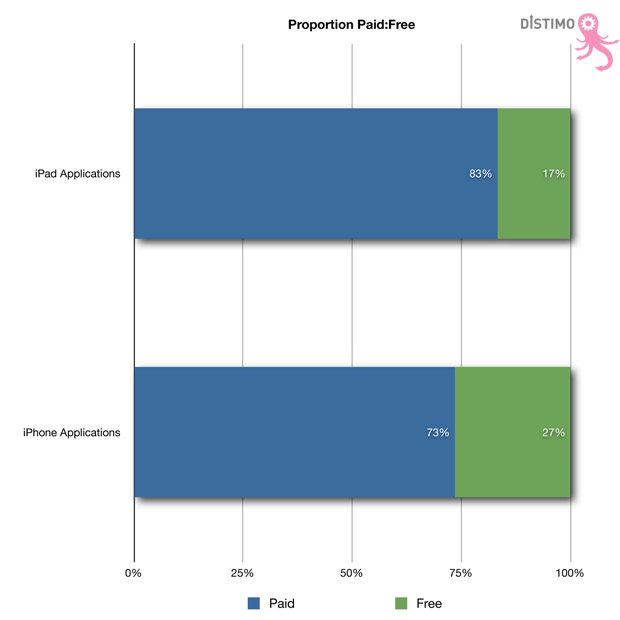
Distimo found that 83% of applications for the iPad are paid, compared to 73% of all applications for the iPhone. We’ll see how this evolves in the future, but I’d wager that both will end up at approximately 25% free vs. 75% paid in the long run.
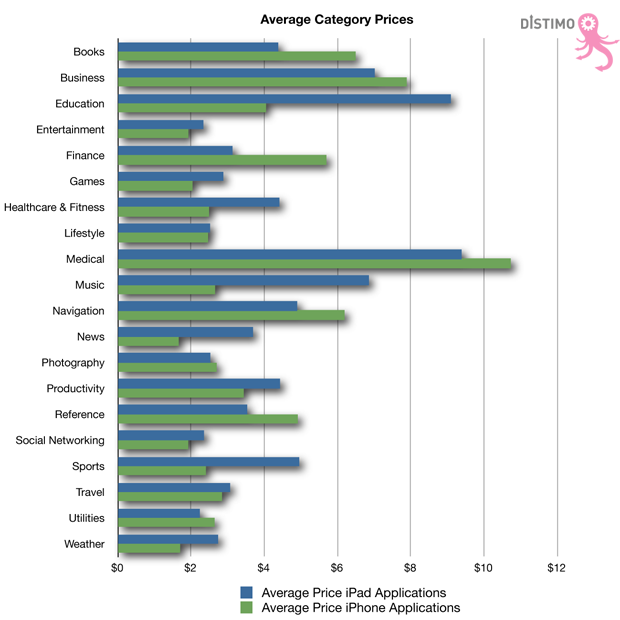
Also worth noting: the average price of all paid applications that are solely compatible with the iPad is $3.61, compared to $3.55 for applications compatible with the iPhone.
Medical applications are most expensive on both the iPad ($9.39 on average) and iPhone ($10.73). On the contrary, ‘Education’ ($9.10), ‘Healthcare & Fitness’ ($4.41), ‘Music’ ($6.86) and ‘Sports’ ($4.95) applications are significantly more expensive on the iPad.
Contrary, books are currently cheaper on the iPad than on the iPhone, which could be explained by the availability of the iBookstore on the iPad right out the gate.
Again, we’ll have to see how iPad owners respond to differences in pricing levels across categories over time before jumping to any conclusions.