
When betaworks launched chartbeat nearly a year ago, the idea was to create a realtime Google Analytics for Websites. Chartbeat is a dashboard which shows you how many people are on your site right now, where they are coming from, and how engaged they are. Watching realtime stats is even more addictive than Google Analytics because you can put something up on your Website and immediately see the reaction.
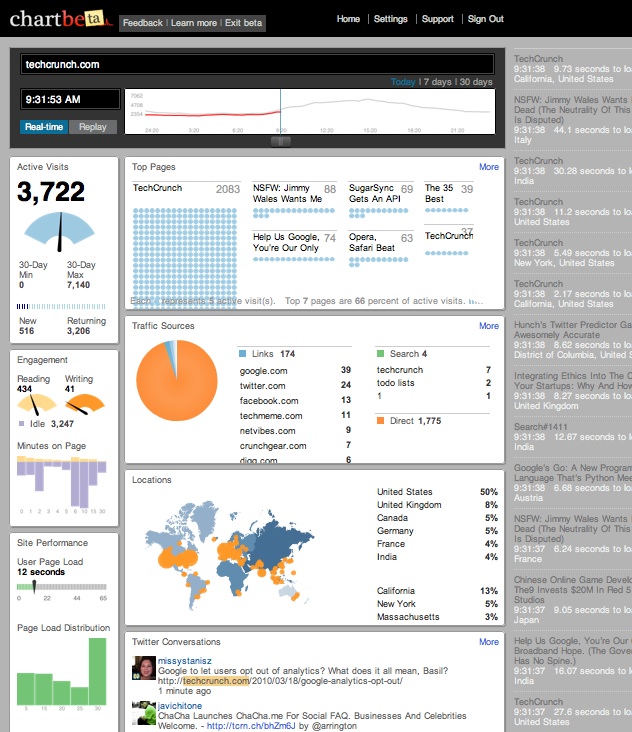
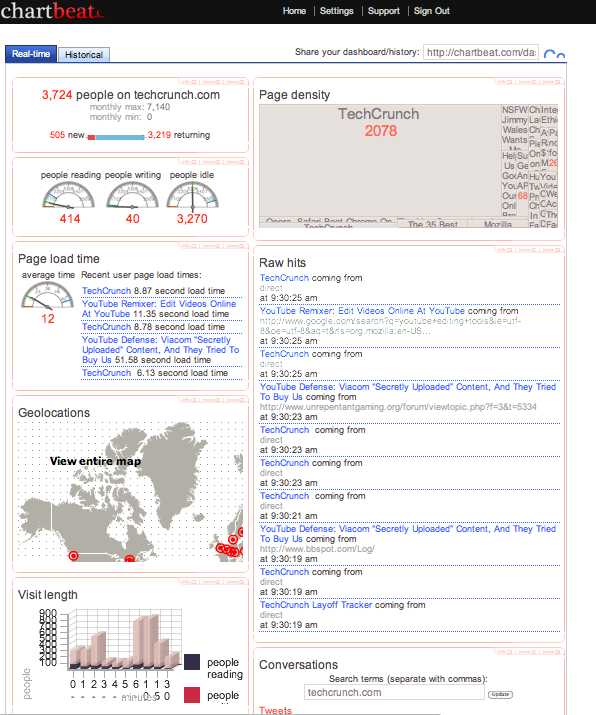
Today, Chartbeat is releasing an entirely new version in beta. The bland design of the old dashboard is being replaced with much more colorful, easy-to-read charts and graphs which pulsate as the activity on your Website changes. (You can see the new and old versions in the two screenshots at the bottom of this post). Up in the top left is a speed dial showing how many people are on your site this minute, broken down by new and returning visitors. Below that are some engagement dials, which indicate how many visitors are reading, writing comments, or sitting idle on the page. Other widgets show load times, the most popular pages, sources of traffic, geographic distribution of visitors, and Twitter conversations. Along the right side you get a snapshot of where different individual visitors are coming from and what pages they are landing on in a continuously updating stream.
Much of this data was available before, but the new version does a much better job of presenting it in a readable manner. The biggest change, however, is that each analytics box on the main page can be clicked on for a deeper view of that particular data (by page, traffic source, engagement, and so on). And as with the original version, chartbeat allows you to replay the past day, week, or month to show you how traffic patterns change on your site. The top stories pulsate green or red, depending on whether they are gaining more readers or losing them. It literally lets you replay and watch the activity on your site.
For news sites or blogs, chartbeat is especially appealing because it lets you see which stories are hot right now. If you are not already featuring a story that is trending, chartbeat provides the data to help you put it in front of more readers before its too late to do anything about it. Chartbeat offers a free 30-day trial, and costs $10 a month after that. Below is a video, showing the new look and features: