 Last month we wrote about Trefis, a new financial site that lets you tweak your stock predictions by adjusting variables in a company’s business model, depending on how you think different segments of the company will perform. These predictions are plotted out on attractive interactive charts, but until now those charts were all housed on the site’s homepage. Today, Trefis is launching support for widgets, giving bloggers and financial experts the chance to share their adjusted stock predictions with the world.
CEO Manish Jhunjhunwala says that the early adopters for the widget will likely be bloggers, freelance writers, and columnists who regularly write about business and financial content. He also notes that the site has gotten requests from a broader audiecne of writers who often write about a particular company (e.g. an Apple fan site).
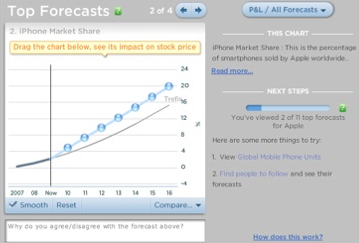
Trefis breaks out a company’s businesses and products into different categories, then lets you manually tweak the contributions of those segments to the overall stock price. For example, Trefis currently says that the Apple TV represents 2.11% of the company’s stock price. If I think that’s about to change — say, because of the release of a new, superior model — I can manually adjust that value and see its impact on the overall stock price. You can get an idea for how the site works using the widget embedded below.
Jhunjhunwala says that the site has seen around 25K unique visitors in the last month.